Visualizing keycap sound profiles with a spectogram

I’m having lots of fun seeing what a spectogram view of keycap sound profiles looks like (I recently got a grab bag from SP which finally allowed me to get my hands on a few OG SA and SA-P). I’ve tried to highlight significant features with green boxes, with line thickness corresponding roughly to prominence.

Keycaps with not a lot of low frequencies are to the left; the more you go right the louder the low frequencies get.

What I love is that you can see how there are several layers to the sound profile—this is what makes it so hard for me to put my finger on what I’m hearing sometimes. So for example, Signature Plastics SA has a lot of low frequencies, but also a very noticable high-pitch plasticky smack that goes with it. MT3, on the other hand, has neither as much base, nor as much high frequency. According to the spectogram, SA-P has the most “pure” low-frequency sound profile.

There are nuances this doeesn’t capture, of course. For example, I personally still prefer the sound of the C64 keycaps over SA-P, because the low end of the C64 keycaps somehow sounds like a softer material, like wood, which is warm and pleasant to me, whereas SA-P sounds just a bit more like, well, plastic. Maybe higher quality audio would somehow bear this out.

Anyway, this is no replacement for hearing the sound profiles in person, but I like what it highlights. Kind of like the descriptions you get on bags of specialty coffee : )

14 Likes

This is what science was meant for. I’m pretty confident that’s true at least. :sweat_smile:

4 Likes

Now this is some tasty keeb science

Very interesting. I wonder what it would take to have a nearly equal frequency response, or if that’s even theoretically possible.

I would think every element comes into play (keyboard material, size, shape, mounting, plate material, pcb, switches, switch mods, keycap material, keycap profile).

Really cool stuff. It’s interesting to use the spectral frequency display to pinpoint what it is you prefer in a particular setup. Pretty smart :nerd_face:

1 Like

Oh this looks so interesting! Do you mind sharing the setup you used and did you have the caps all in a horizantal line on your board in the middle? I love the idea of putting a visual comparison with sound - really cool.

I’m sure you didn’t have a spacebar for each of these keys, but your comments about SA ABS vs MT3 reminded me of how different those to space bars sound on the same setup.

1 Like

Right, and I tried to keep these variables consistent across keycaps so that at least the relative differences are accurate. That said, one thing that isn’t consistent is the exact placement of each key on my keyboard; in order to make recording them all at once easier, I just lined them up on the home row. So that’s something I could improve in a second test. A couple of other things I could improve:

  • Using linear switches. I used modded Clickiez in tactile mode (they’re modded to have lighter tactility), but I wonder if the tactile bump doesn’t add unhelpful sonic detail.
  • Comparing actual typing sounds, rather than just an isolated key. This would require having full sets of SP, which I don’t have. But I do have samples from a couple different rows, so I could at least use that.
3 Likes

For now the setup has been pretty simple: I just used my phone mic at a 1-foot distance (I tried much closer but the recording sounded very different from what I hear when typing, I guess because the frequencies each travel differently) and yeah, lined the keycaps up on the home row with the swithces I just so happened to have in my daily driver.

My theory was that although I could probably get more information with a better mic and if I knew more about audio, what information I did get would at least be accurate provided all variables were equal.

1 Like

I think showing the relative data is great! What’s your daily driver?

An 8BitDo M edition TKL. But if ever I can find a good deal on an NCR-80 with Bluetooth support, that will promptly replace it!

2 Likes

All right, I’ve got some new graphs!

This time, I’m rolling a series of three keys, rather than hitting one key, and they’re all in identical positions. They’re also on linear switches.

The first graph is pretty straightforward: just the frequencies plotted over time again:

When comparing with the second chart below, I think this first method is especially useful for the way that you can so easily see what’s going on in the 6–16K range at a quick glance (although I’m not sure why it clips above 16K, since you can definitely hear above that…).

The second chart is the same audio but graphed with an EQ curve (the frequency over time averaged) for each keycap profile. Keep in mind that in order to create the second graph, I had to go in over my head as far as technical knowledge about audio, so this is just me fiddling around without always being super sure of myself (using the SPAN plugin in Garageband). The scale is logarithmic so we can see a bit more of what’s going on in the low frequencies.

I love this second graph, especially because it makes details in the low frequencies so much clearer. A few observations:

  • You can more clearly see now that SA-P is the winner in terms of base.
  • QX SA is the clear loser in the base range.
  • You can really see how SP SA is just an all around loud profile.
  • QX SA on the other hand is the quietest, except for in the high-pitch range where it stands out… which isn’t surprising for a cheap knock-off set.

One thing I wanted to do with the EQ curves is specifically focus on the three deepest-sounding profiles: SP SA, SA-P, and the C64 keycaps:

Previously, when just listening, I was under the impression that SA-P is significant deeper than SA, and that C64 is significantly deeper than SA-P. But that doesn’t seem to be true. Instead, the more distinctive features seem to be (funnily enough) what is going on at the opposite end of the spectrum, and that’s probably what I was hearing. Some thoughts on this:

  • SA-P has this interesting dip between 3K and 7K which I imagine corresponds to the more dense, muted sound in comparison to regular SA.
  • My best guess as to why the C64 sounds so deep and “woody” to me is because 1) it also has a dip, and one that’s even longer compared to SA-P, and 2) it has a quieter smack, although it is higher-pitch than SA-P’s. Maybe that peak at 600 hertz has something to do with it too.

Anyway. I could go on forever, there’s something really satisfying about this. But I’ll stop there for tonight!

2 Likes

One potentially valuable thing to consider trying would be to sort of take a pseudo impulse response (quickly tap a single key as you would a normal keypress) and represent it in a cumulative spectral decay plot (waterfall), you would be able to get a better idea of where different keycaps resonate and the loudness/intensity they resonate at.

I’ll see if I can do one today as an example, although I don’t exactly have any real proper measurement mics around to get super meaningful results (will try with a Josephson C716 or U87i in omni for now, I don’t have any omni sdc on hand to get real results). But I’ll do a test of GMK vs DCS on a random board and see if I can get a usable result.

Edit:

Very quick/lazy test with a u87i directly over in omni with a masjewerke kiii with browns, not the best board to use with this sort of a test (inherently resonant, mx browns will not be as sharp/clean as blacks), but just wanted to see how this would turn out lol

Interesting differences, though I hesitate to comment considering the less than ideal setup (improper mic, improper board to really nail this down on, and would want to be more controlled in practicing hitting the key exactly the same each time), but the main things you want to look at here are that you get more separate spread out more spikey resonance with DCS vs GMK being generally cleaner with strong resonance centered more around the middle. GMK has the predominant freq linger longer with a less full response, so more decay and less rounding off as the keypress tails off giving a cleaner sounding response, DCS offers a fuller more rounded sound profile but isn’t as clean as GMK

Can see some of the differences represented in the FR of the general sample, but you miss out on seeing how sound truly resonates/lingers throughout the entire keypress vs CSD imho

1 Like

You know what you’re doing way more than I do, so this is cool to see. Especially the CSD plot.

What software are you using?

Right now just using ARTA which while it works is limited on how long of a sample can really be imported and displayed, so also maybe not ideal for keyboard recording but it works well enough to display what I was thinking of I guess lol.

It might also be helpful to view them from an overhead perspective (sonogram) as well to make differences a bit more clear if you’re not used to looking at it from a 3d perspective, you can almost see the roundness a bit better of DCS lol

There are limitations to what value you can get from any measurement, and also depending on how you configure your CSD you also might end up with a time domain accuracy loss or a frequency domain accuracy loss, personally I prefer caring more about time and getting shape in this instance but all depends. I think bust decay also might be useful in some instances but not sure if the difference between that an a csd would be as valuable here. I’m not really the most experienced with proper measurements since I haven’t really found them to be all that valuable in general vs just listening and experimenting but it’s interesting nonetheless lol

For the above plots I’ve been using a log freq axis, no smoothing or fr comp, apodizing with .2ms window rise, 512 samples, 2 sample block shift, and 200 max blocks, which I think is a decent balance to getting usable results

Ah, bummer, I currently use macOS which isn’t supported. But now that I know what terms to search I can look for alternatives.

Personally I think the 3D view rules, it’s so awesome!

Thanks for sharing your parameters, that might come in handy.

1 Like

Wonder if there’s a vst plugin or something for CSD that you could use in garageband, but since ARTA is an older simple program, you could also try installing it through Wine if you know how to do that, should be pretty simple. I’m on mx linux and I was able to get this installed and going through Proton.

Another free option would be using something like Room EQ Wizard and generating from there, even though it’s a different purpose it should still work well if configured correctly and I think it supports mac natively. Other things I think of off the top of my head are either kinda proprietary or expensive lol

A lot of coloration to our ears of sound comes from the time domain imo, so I just like having measurement representation options that represent that focus a bit better (but are more complicated to do correctly), though I think a spectrogram is also a pretty intuitive choice to use as well (although not in the measurement I took, since that was more impulse related, it’s more useful for an overall length of typing). But I’d rather just hear it myself and decide lol (and I’ve already wasted enough time tweaking a setup and methodology for recording the sounds of boards normally, I don’t know if I have the time to do that + work on a proper measurement setup, so maybe that’s speaking out of laziness lol)

Edit:

Thinking about it further, there’s some work that I would need to do on these to get meaningful results. I’ll experiment with CSD apodizing vs STF hanning (a hanning window will reduce bleed/spectral leak making things more readable/clear but also mask a bit of lower level time interaction) and see if one would make better sense for this application than the other, STF might give more meaningful results with a nonconstant audio signal like this (CSD is more suited toward a proper true impulse), I need to experiment with window size/block shift and figure out how long it actually needs to be (2ms feels way too short), and drill down FFT length for the best balance between frequency and time resolution (I would prioritize time with this sort of measurement, but I still want a decent balance). I’ll also give this a shot on a board with linear switches that’s less resonant to make this a cleaner test. All of it is still limited by non ideal mic but I’m just working with what I have on hand lol

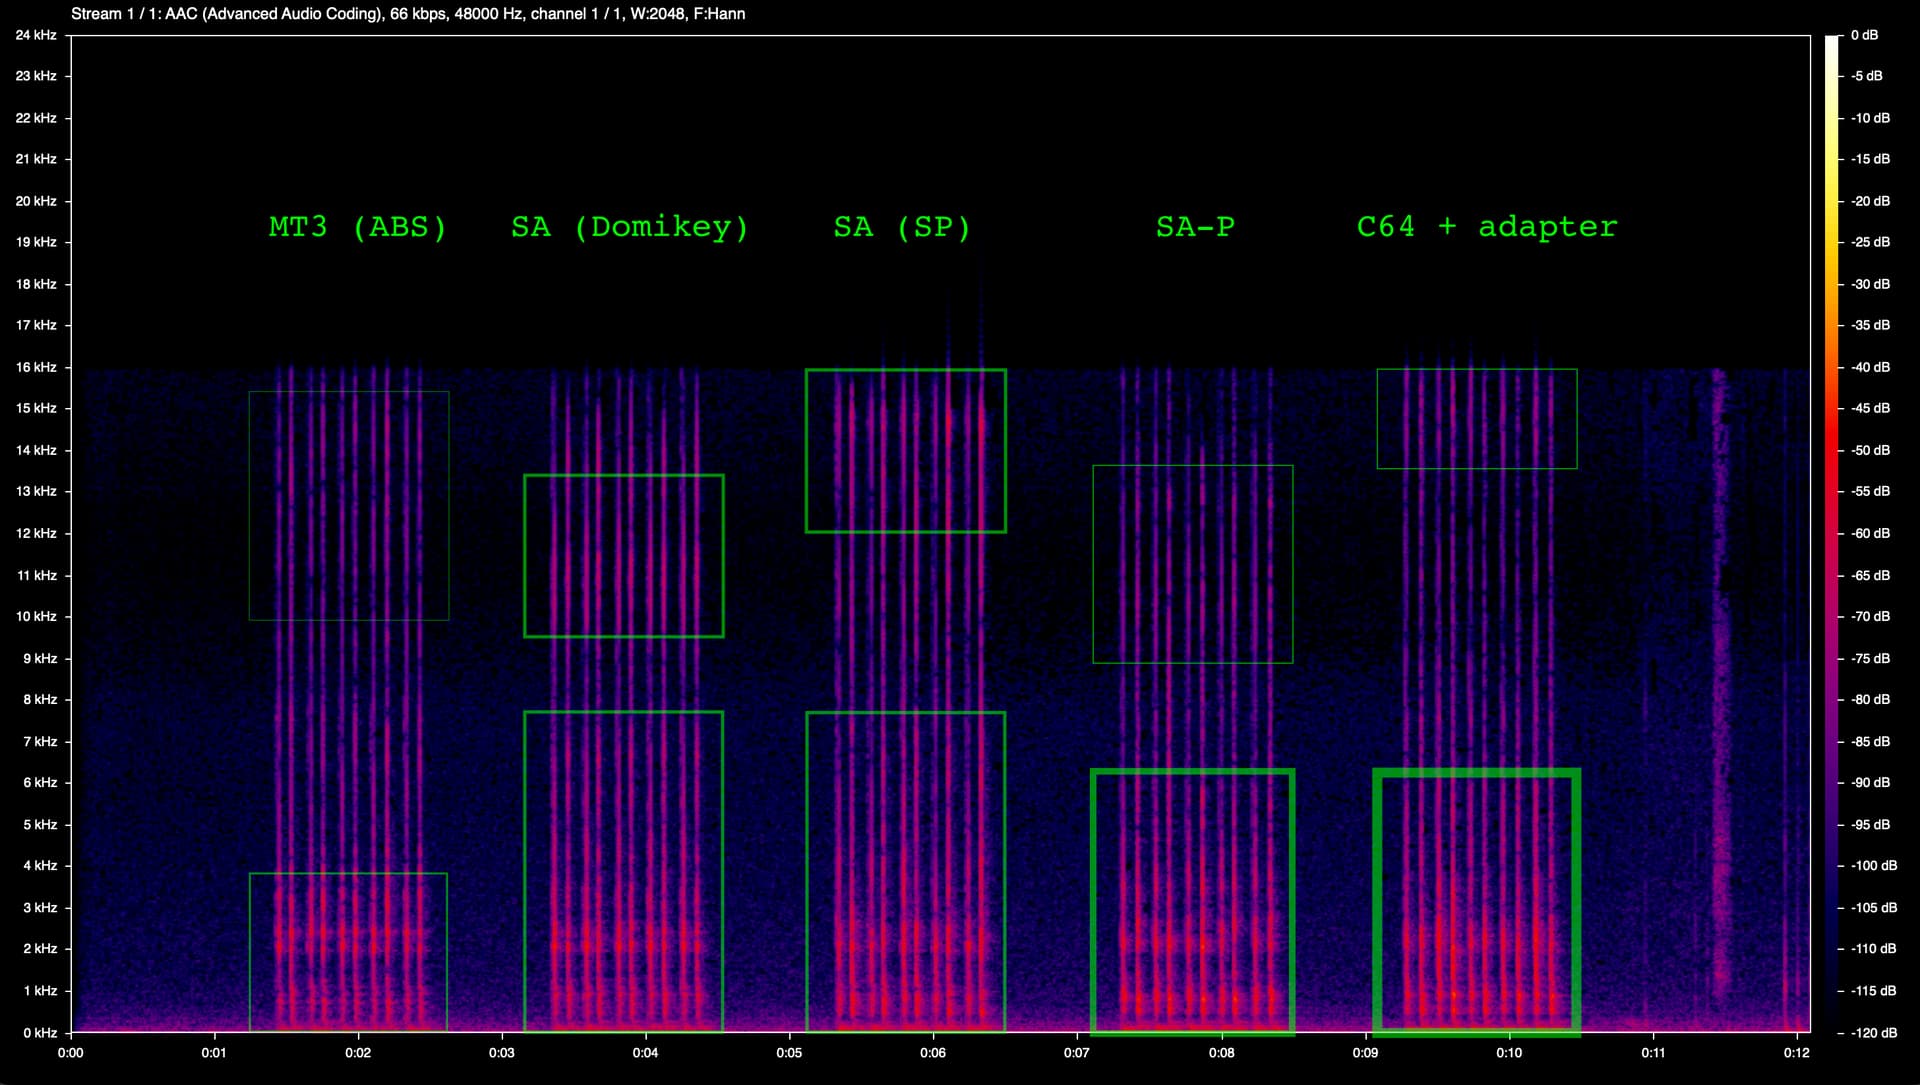
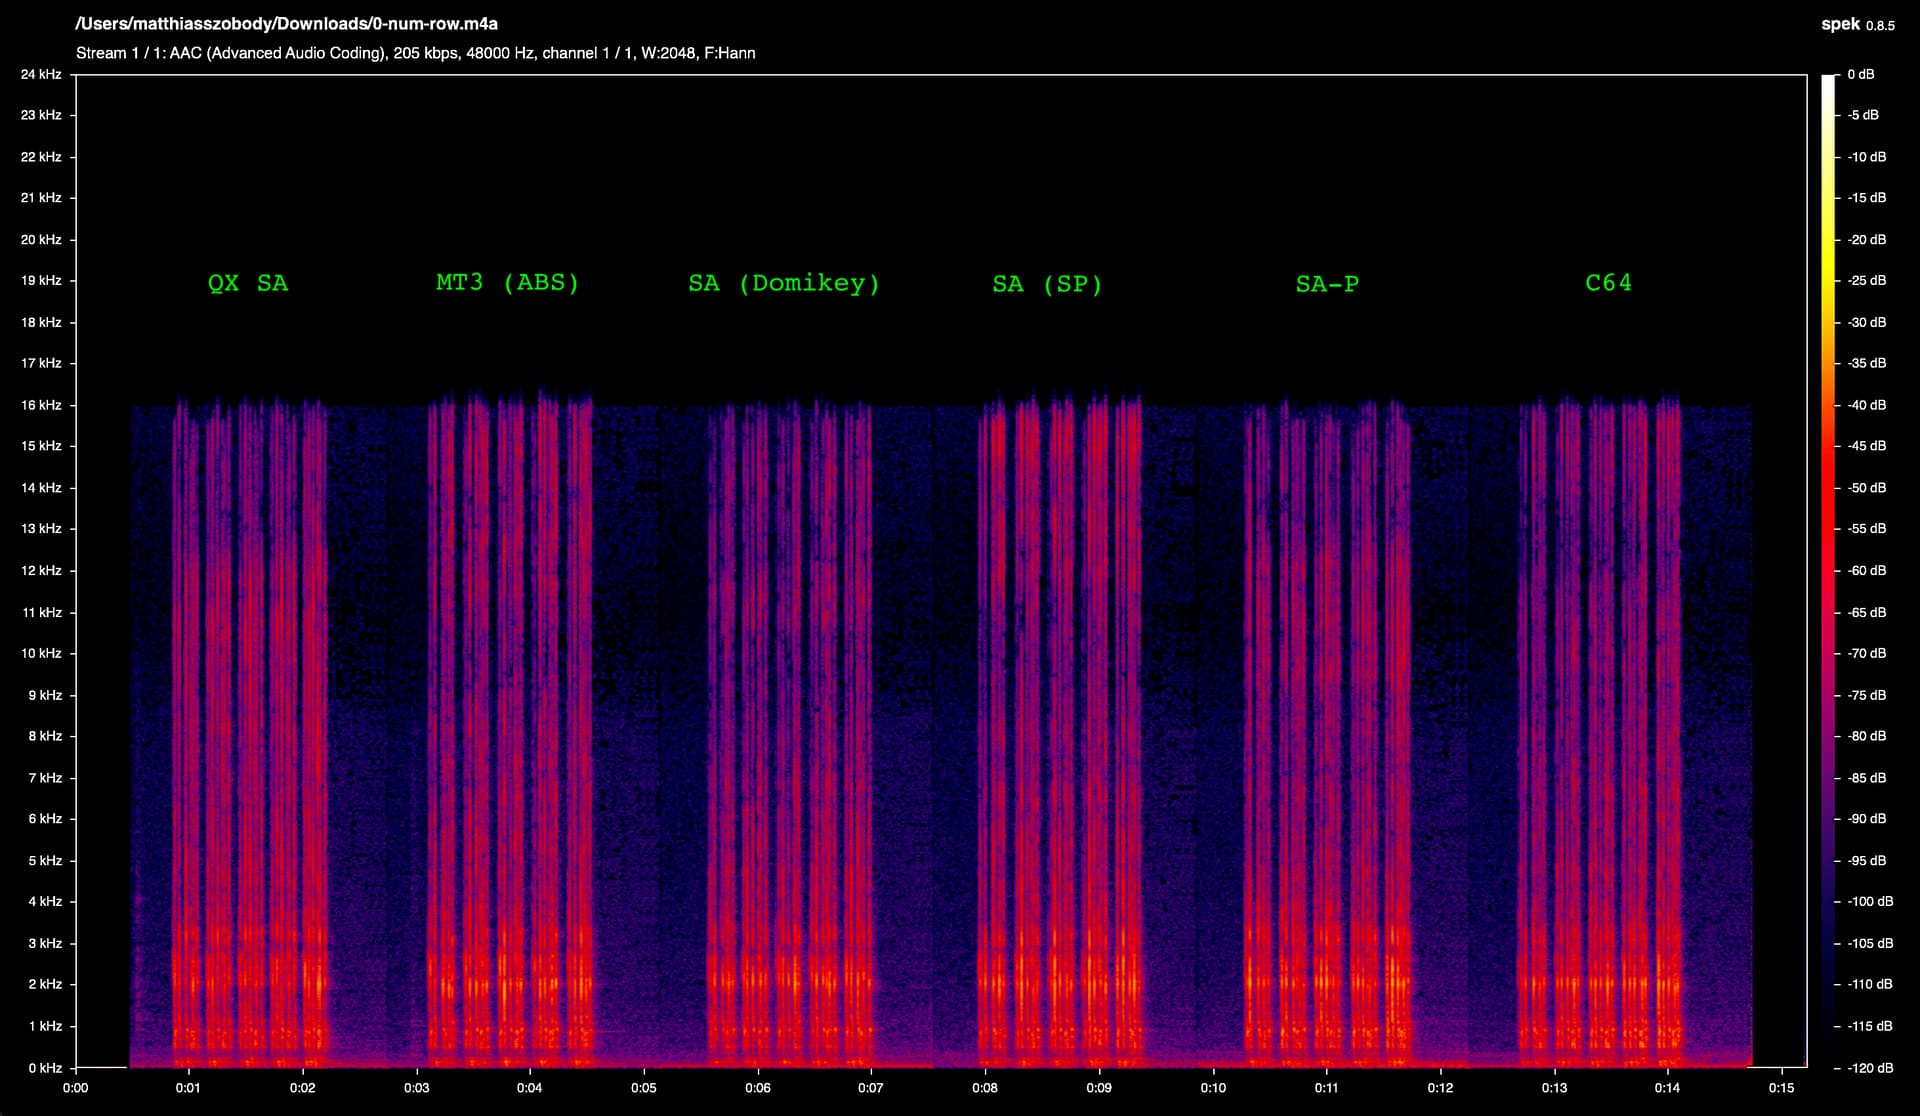
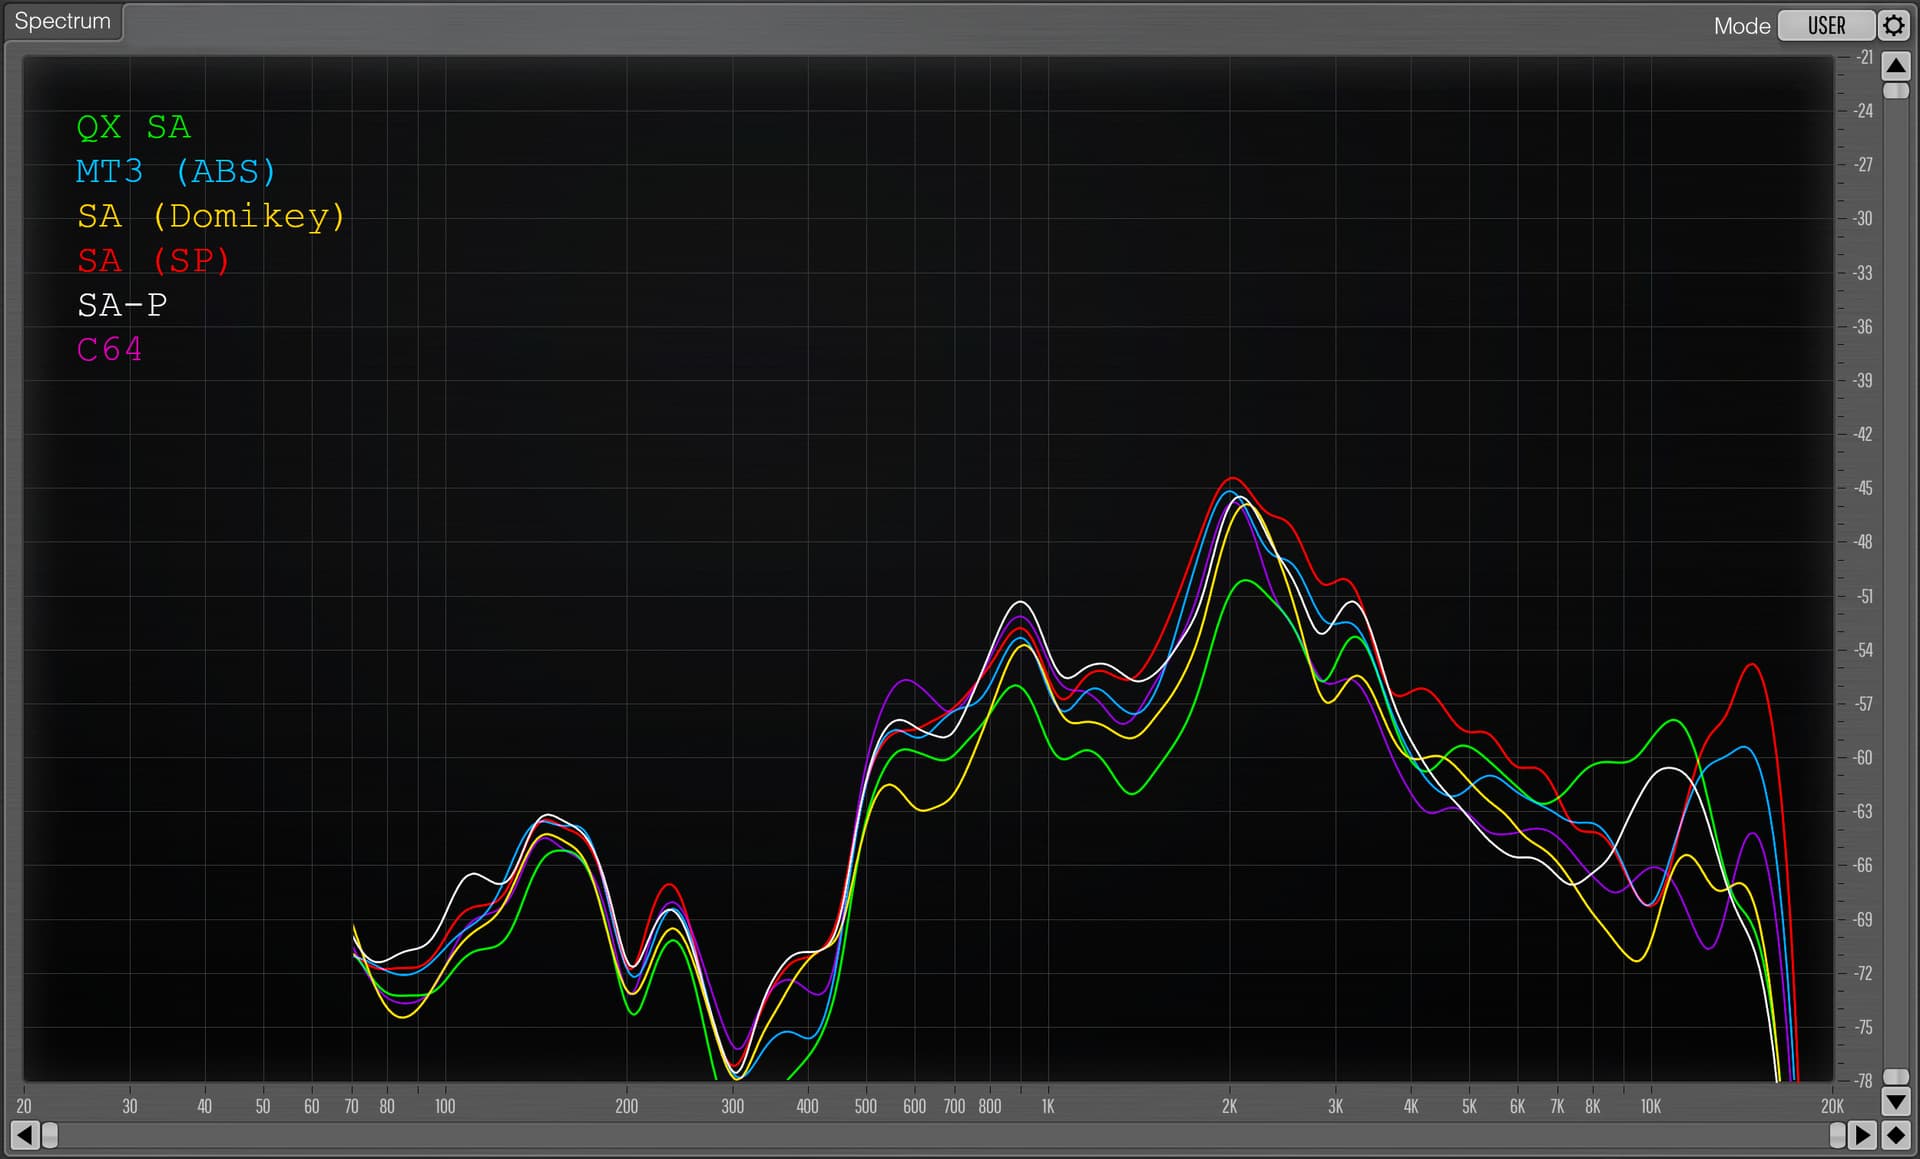
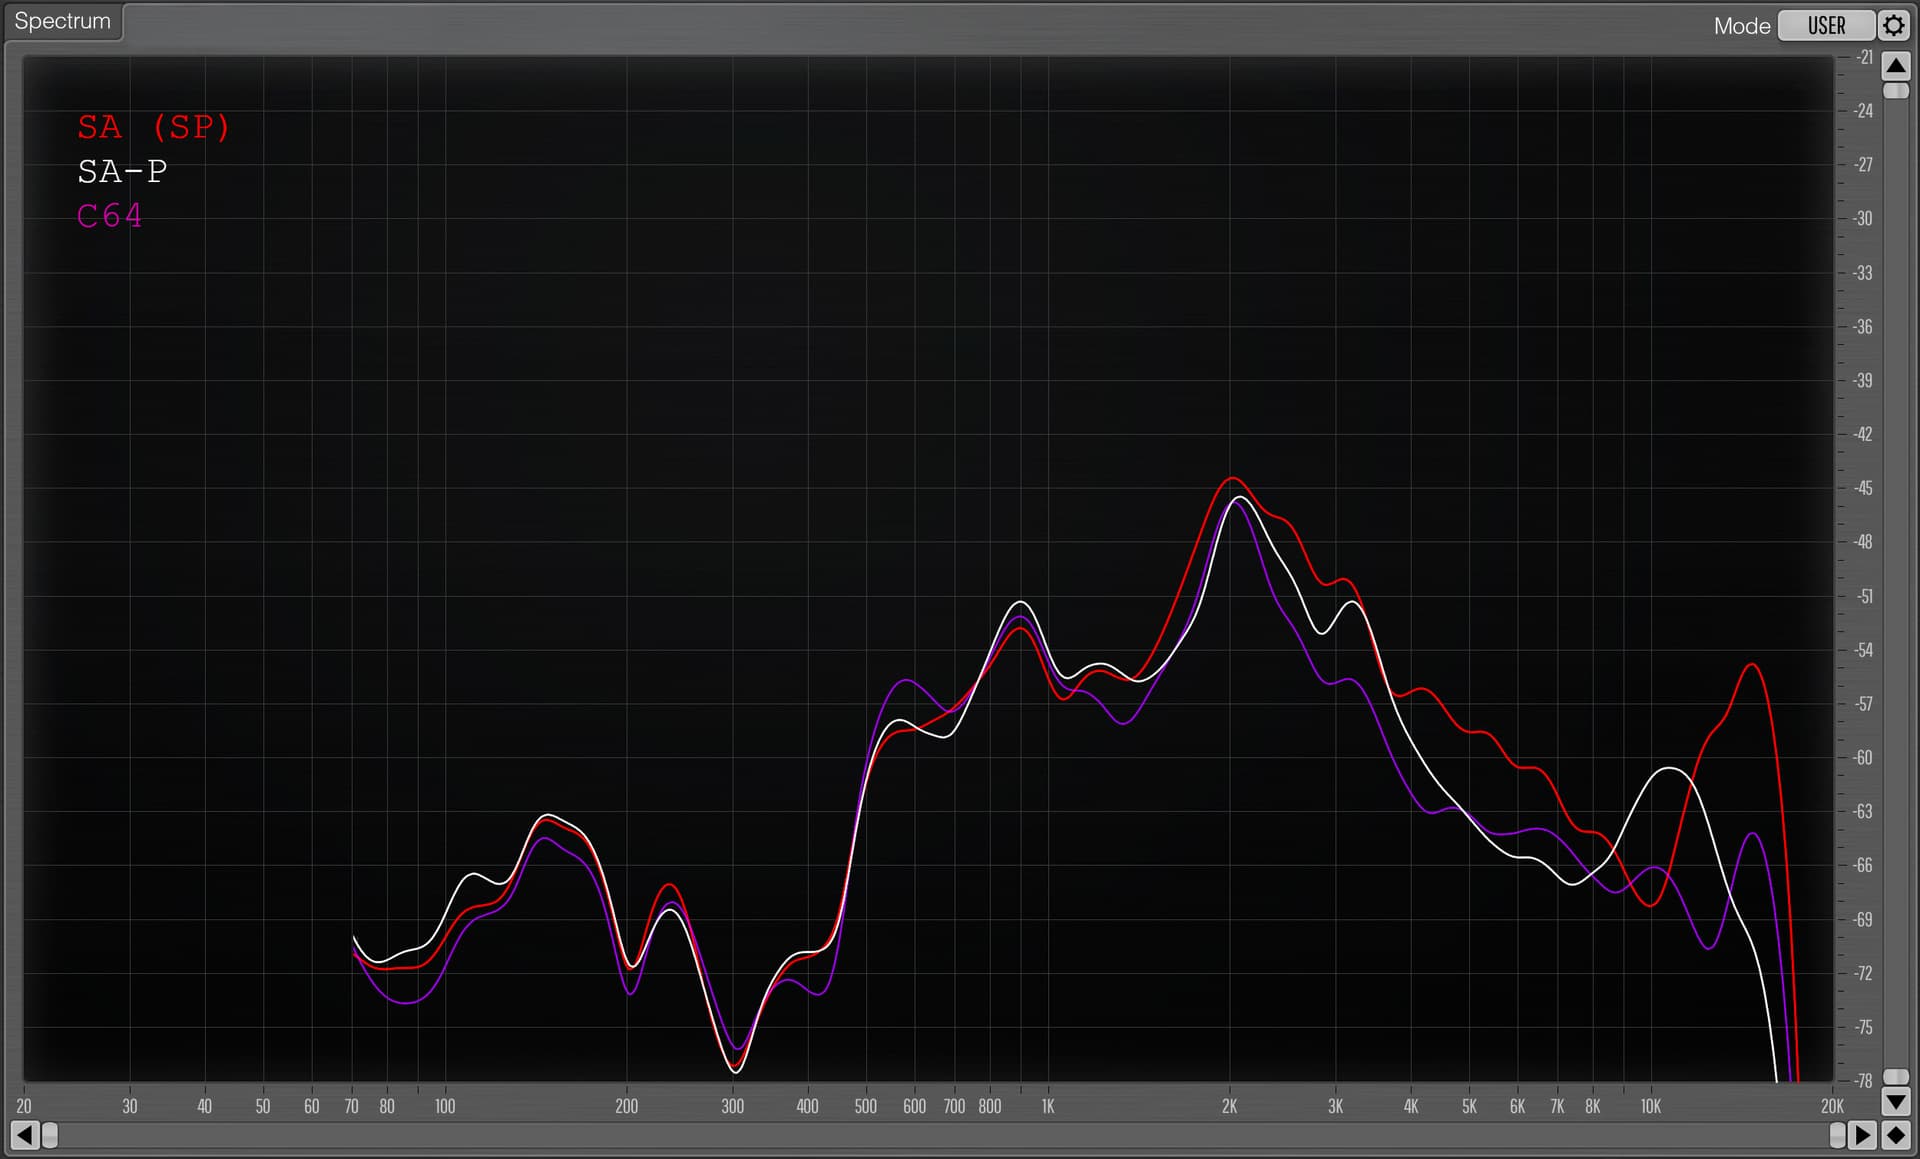
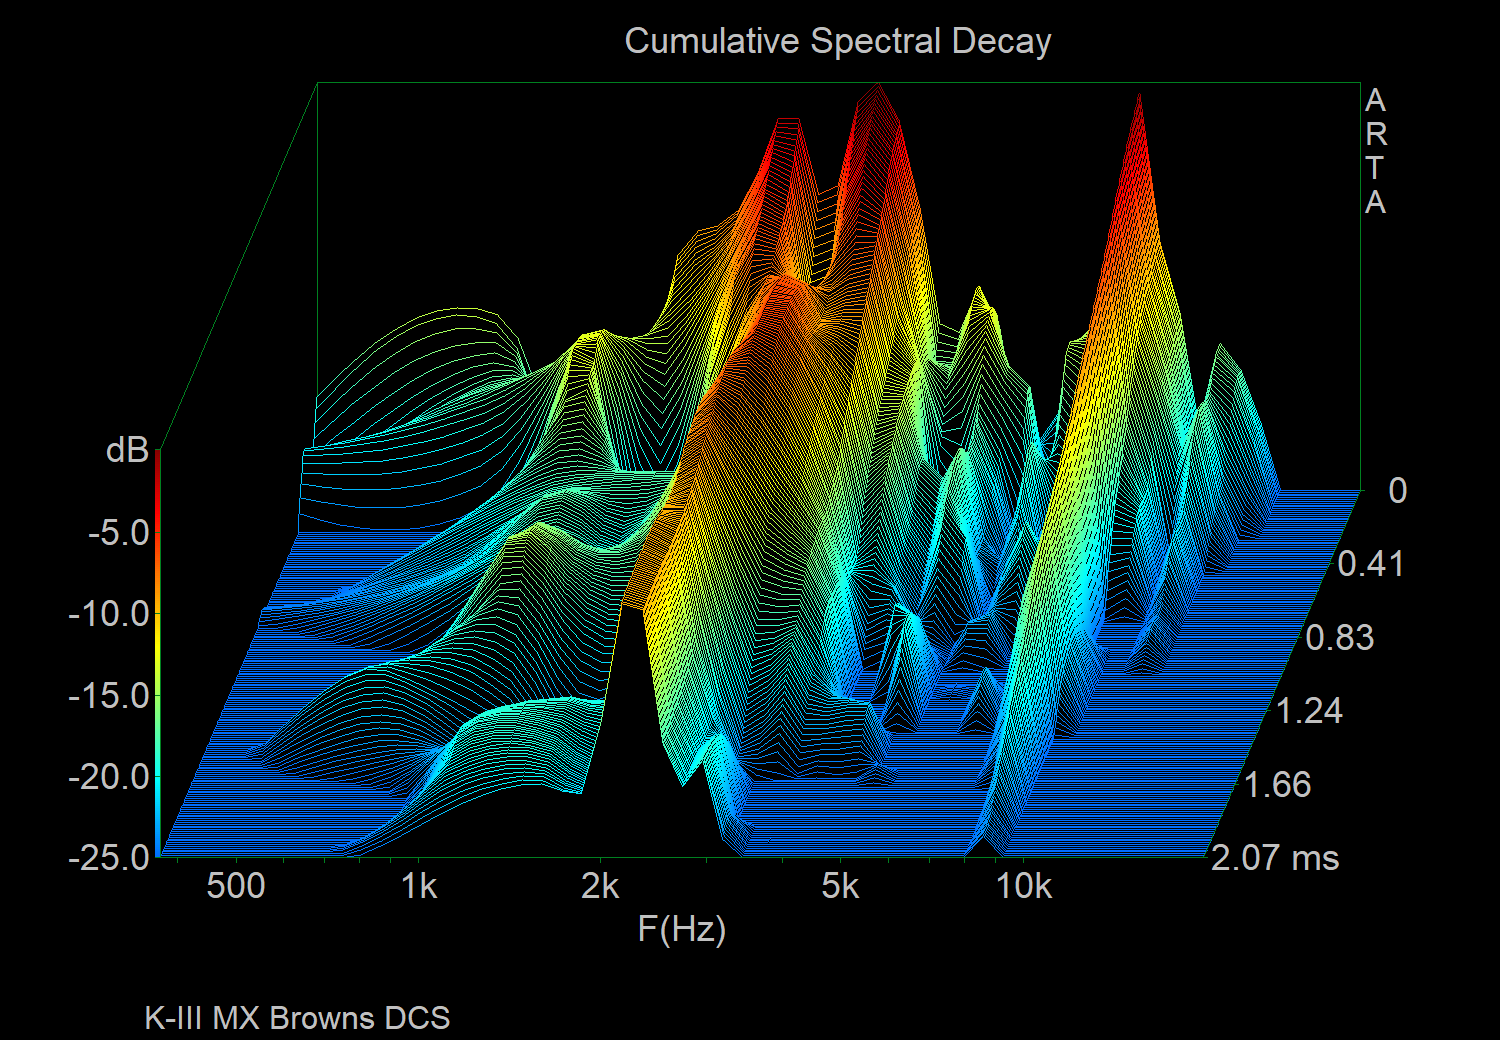
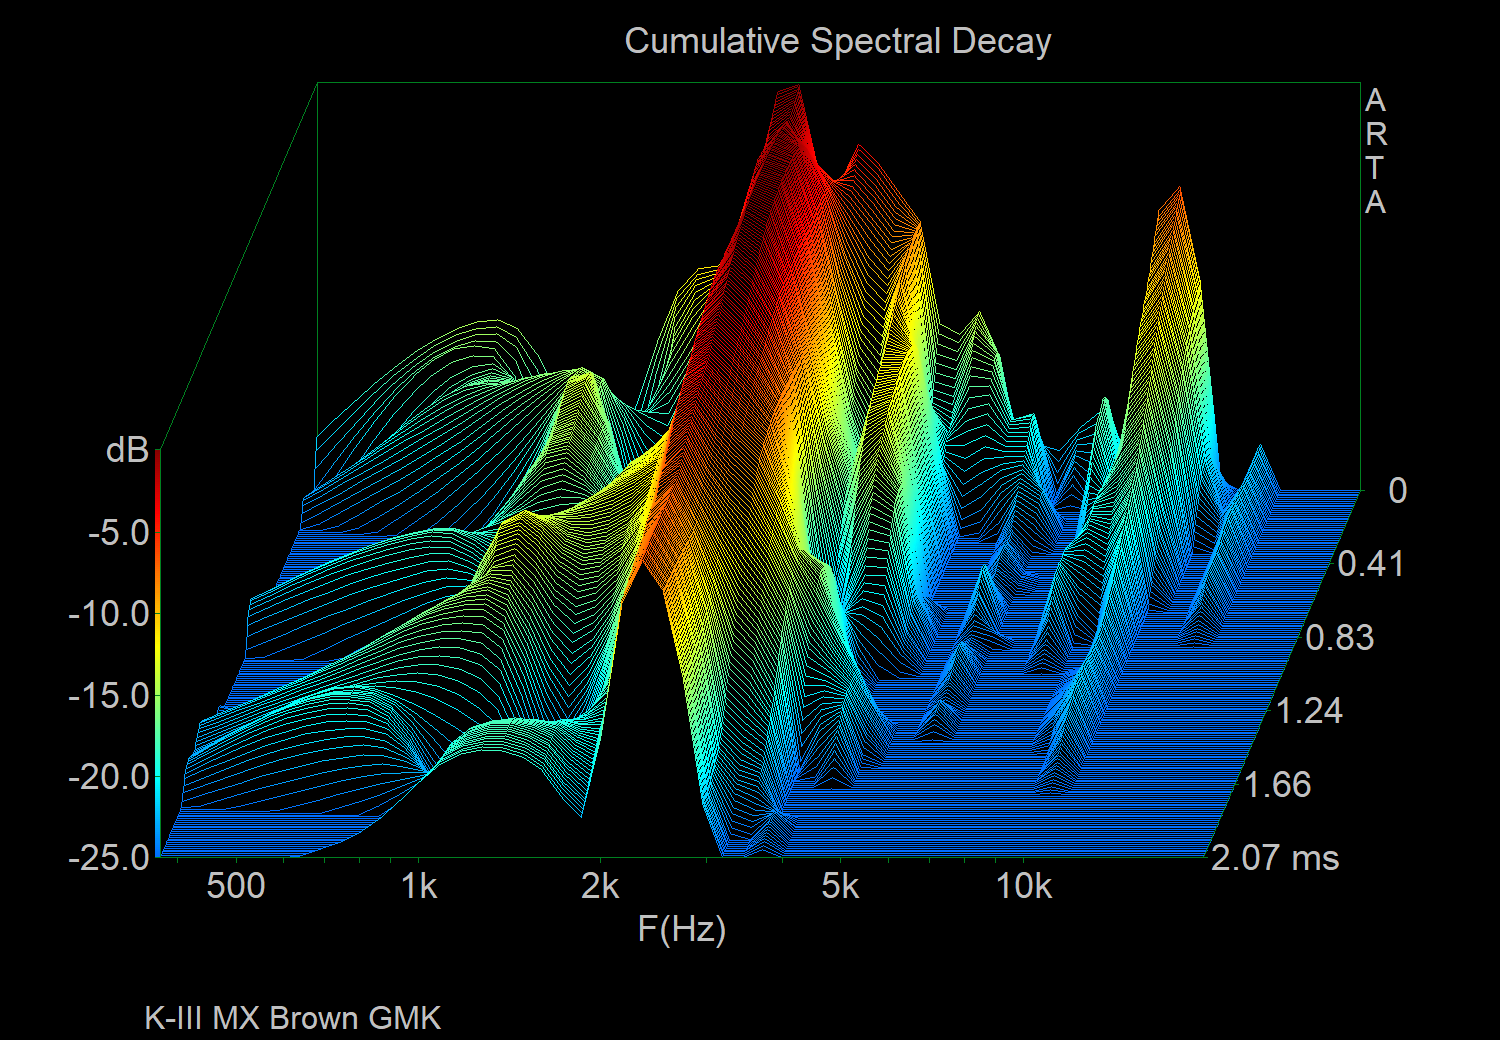
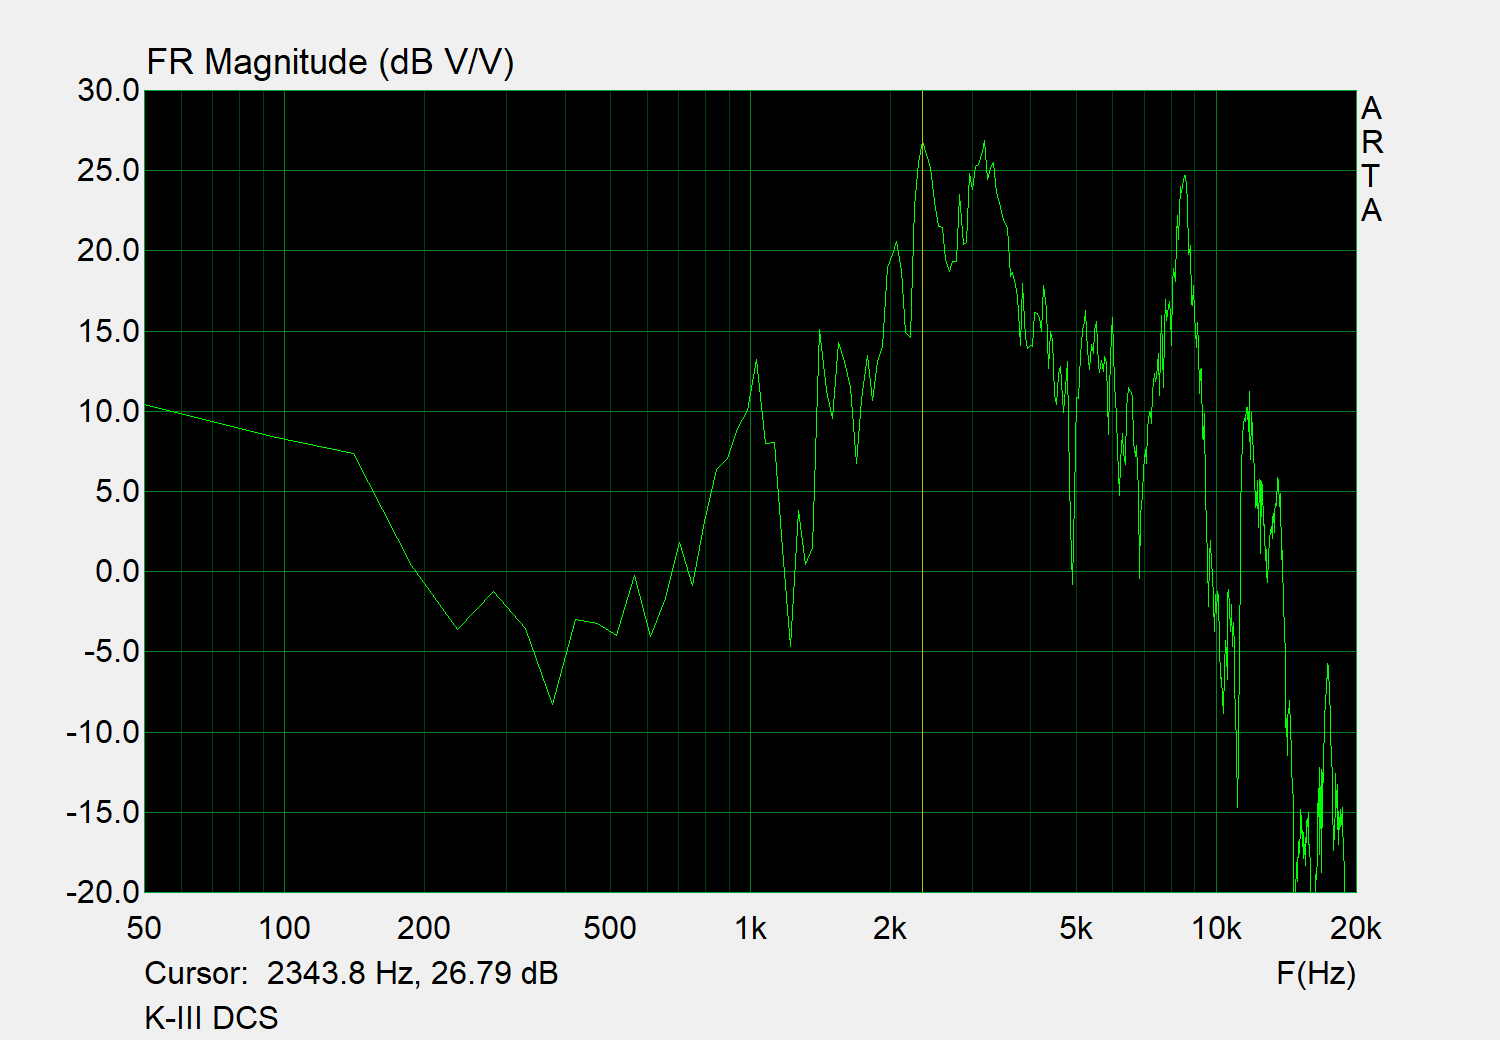
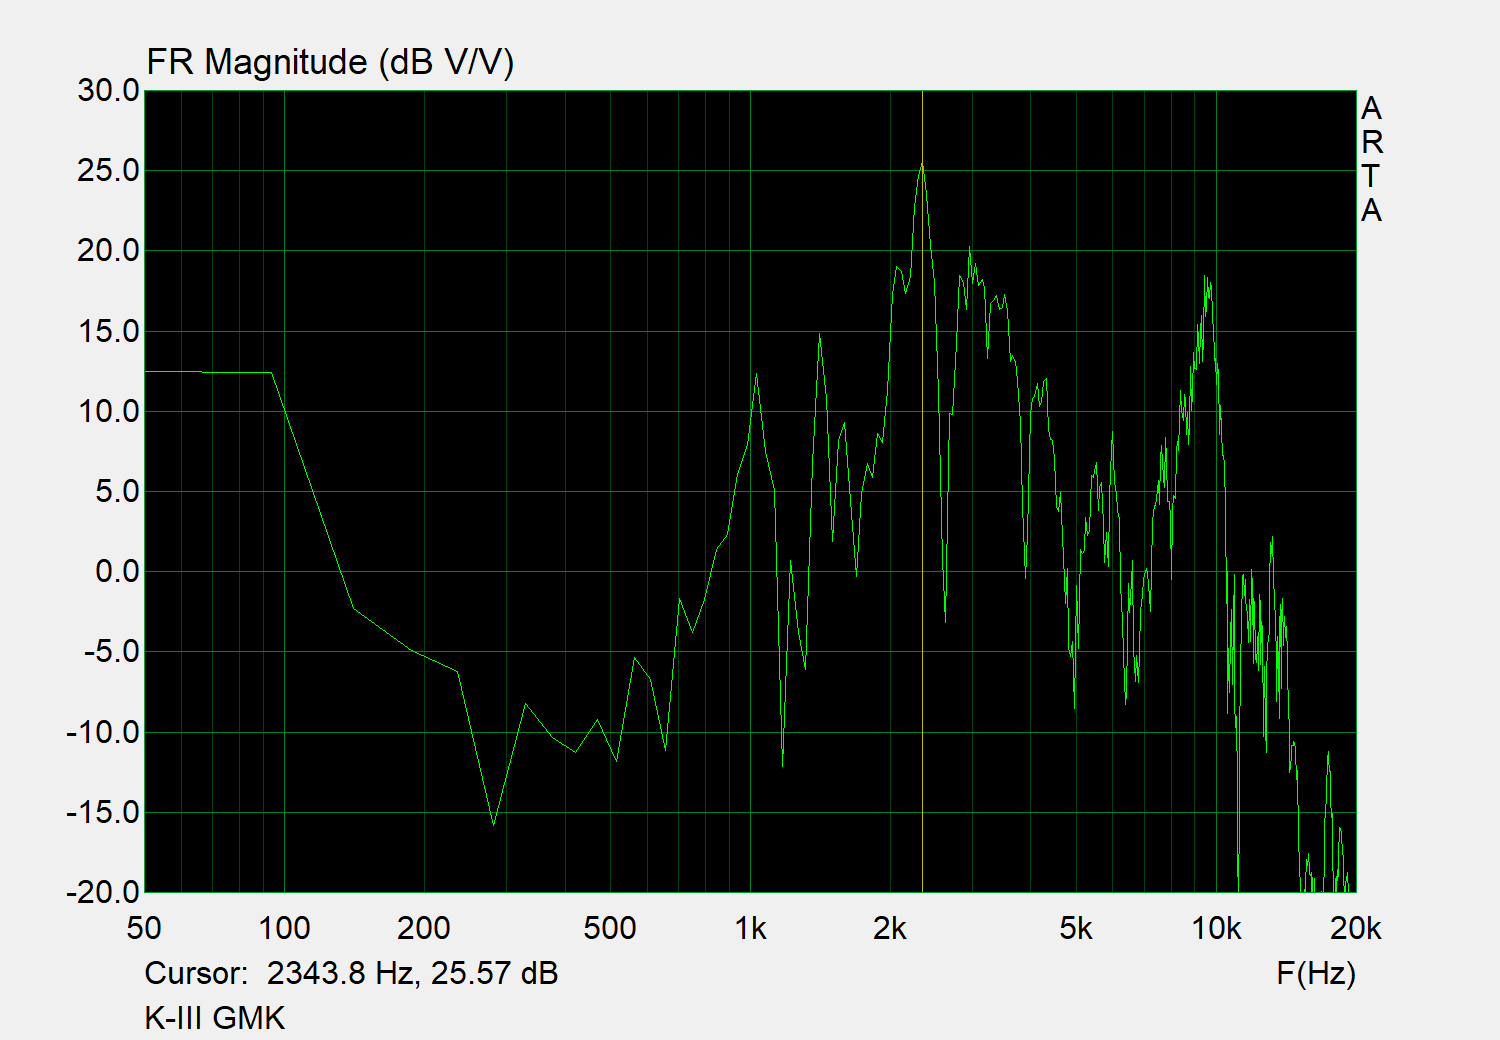
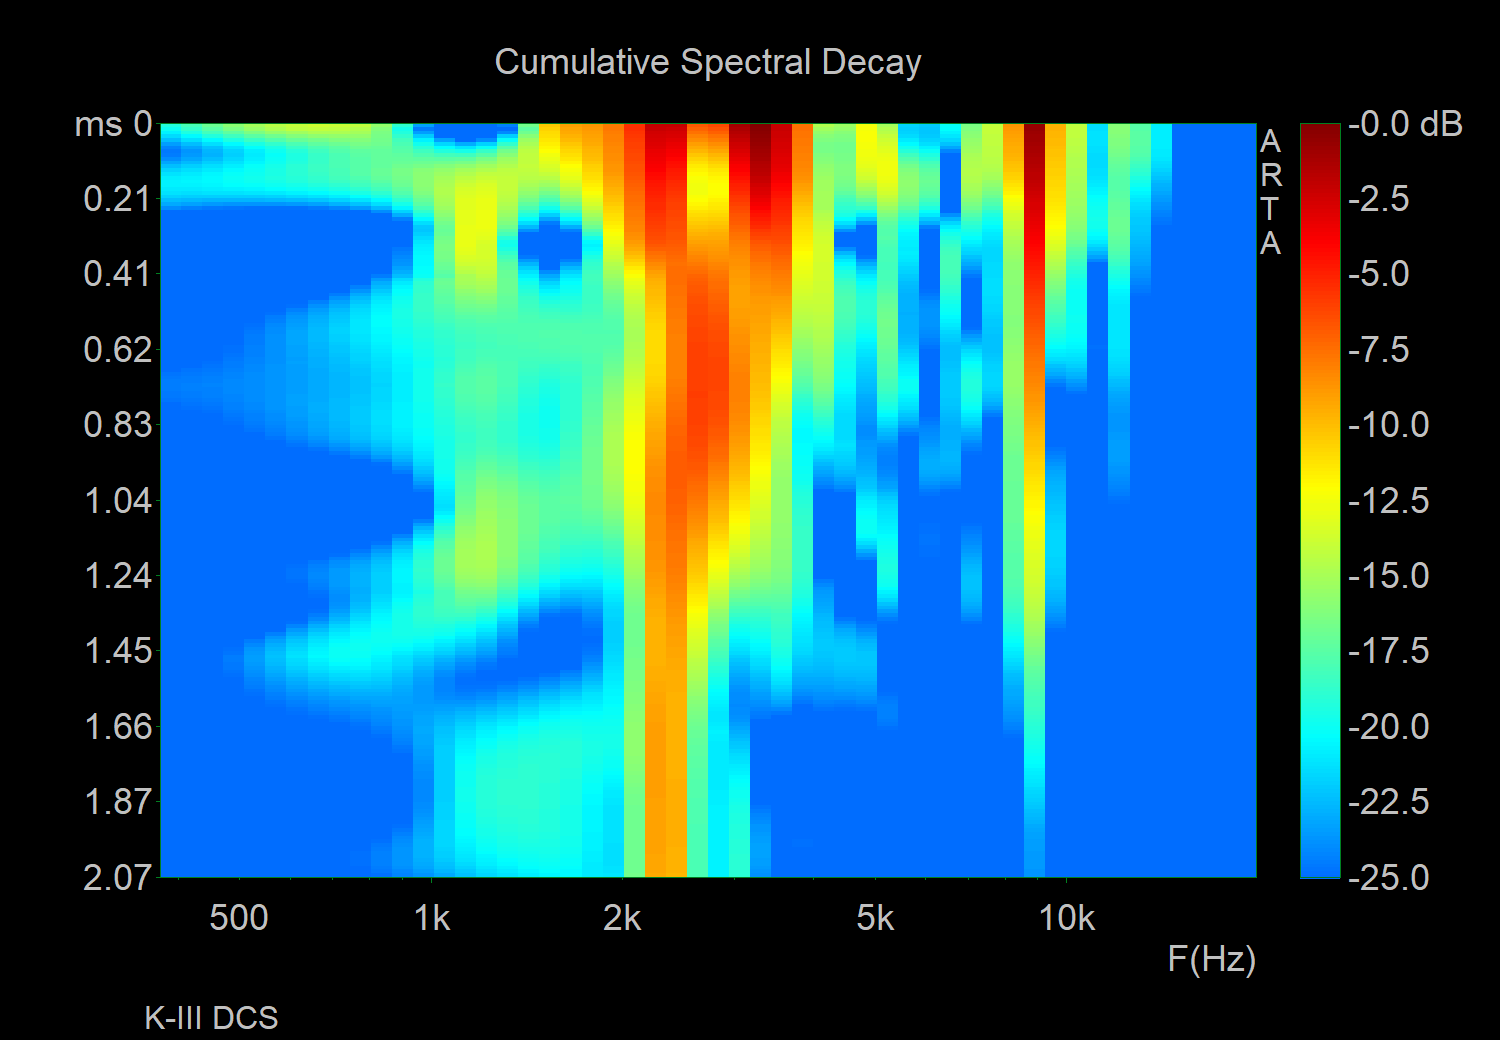
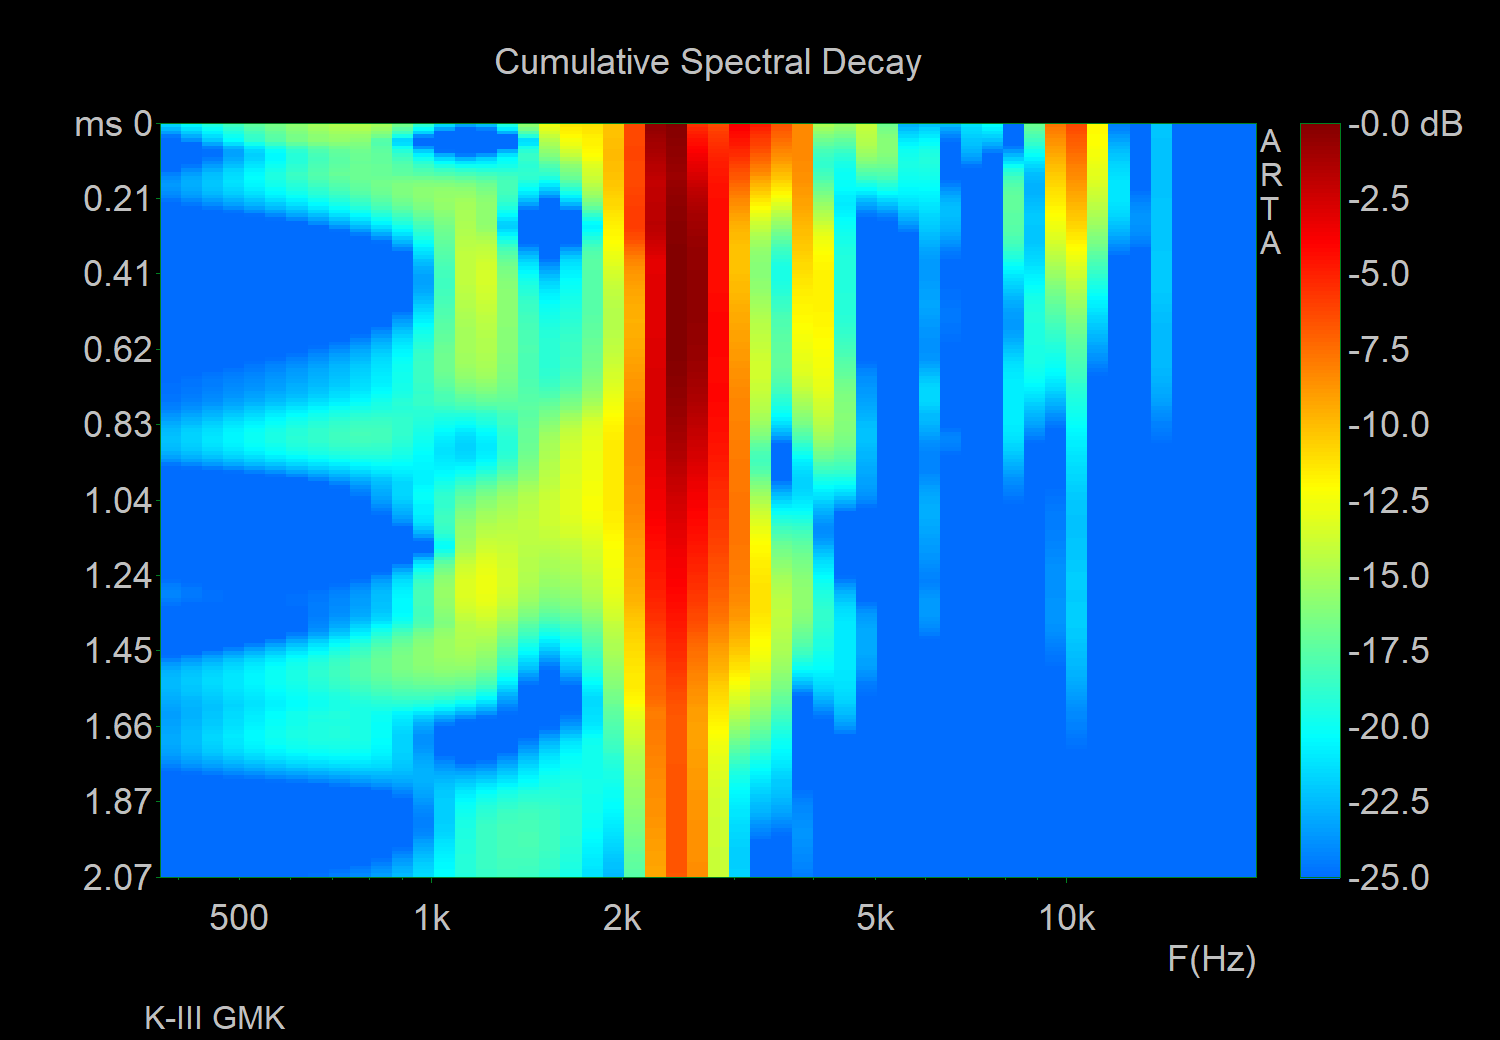
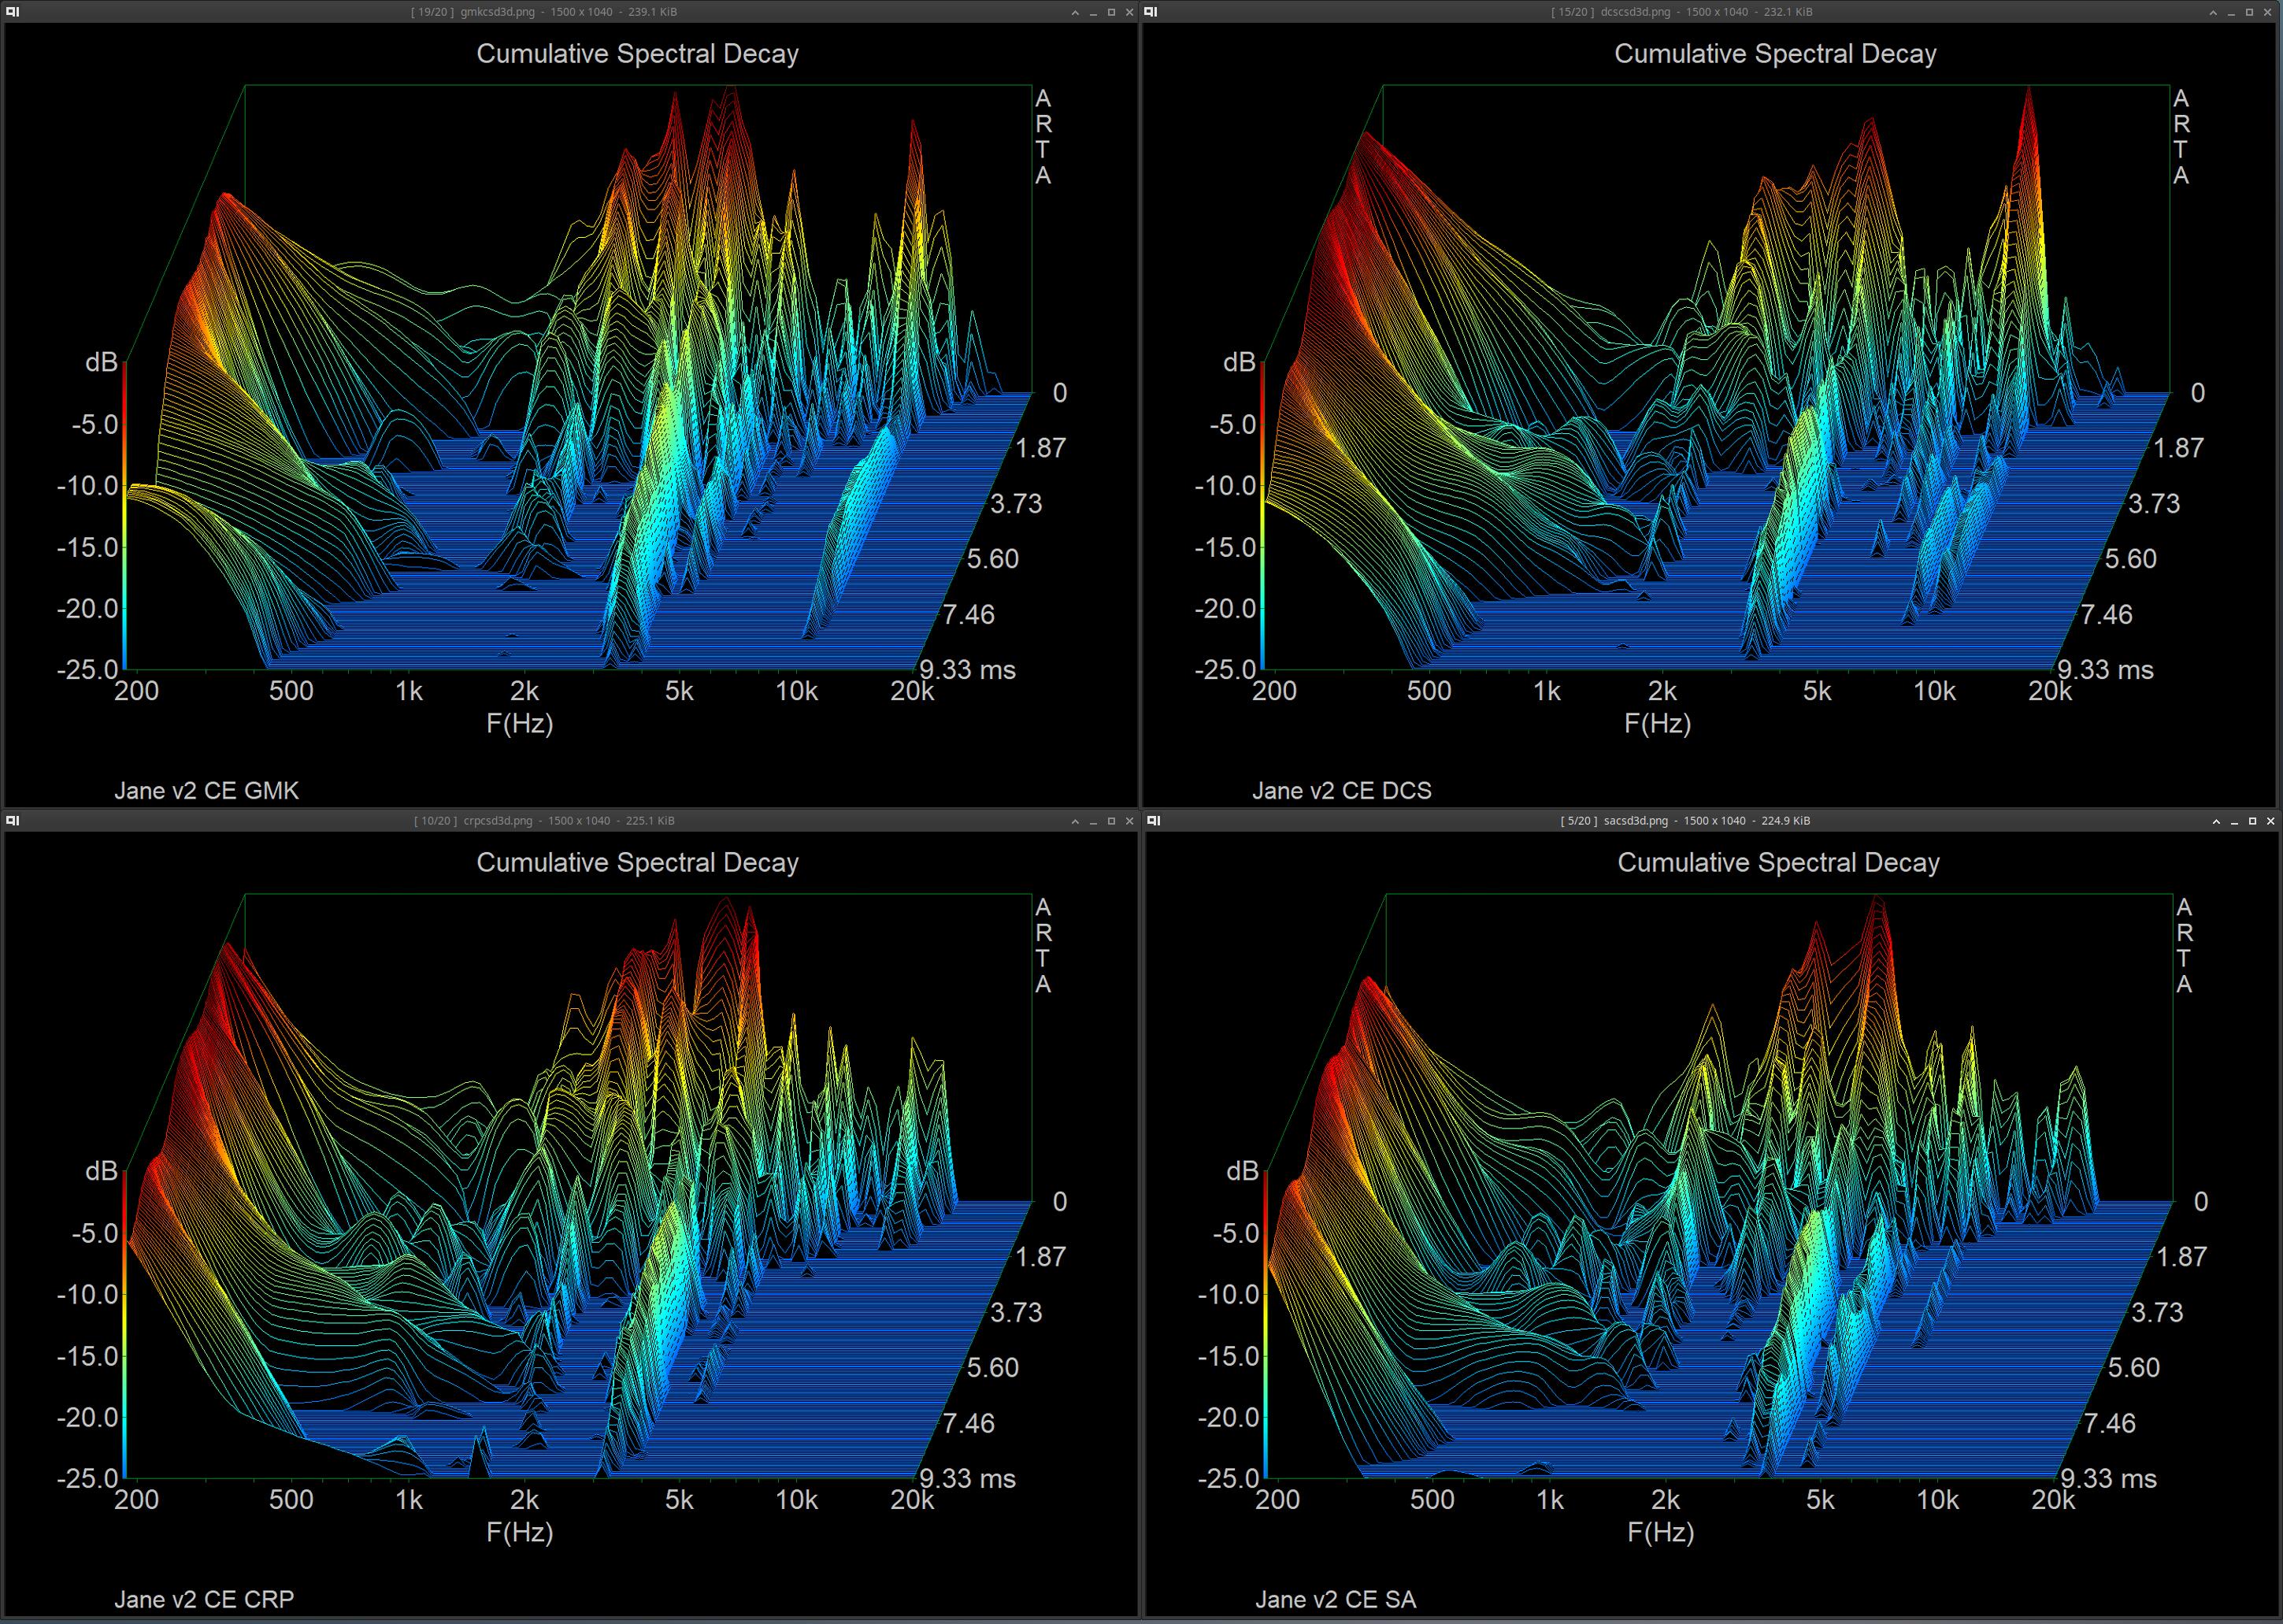
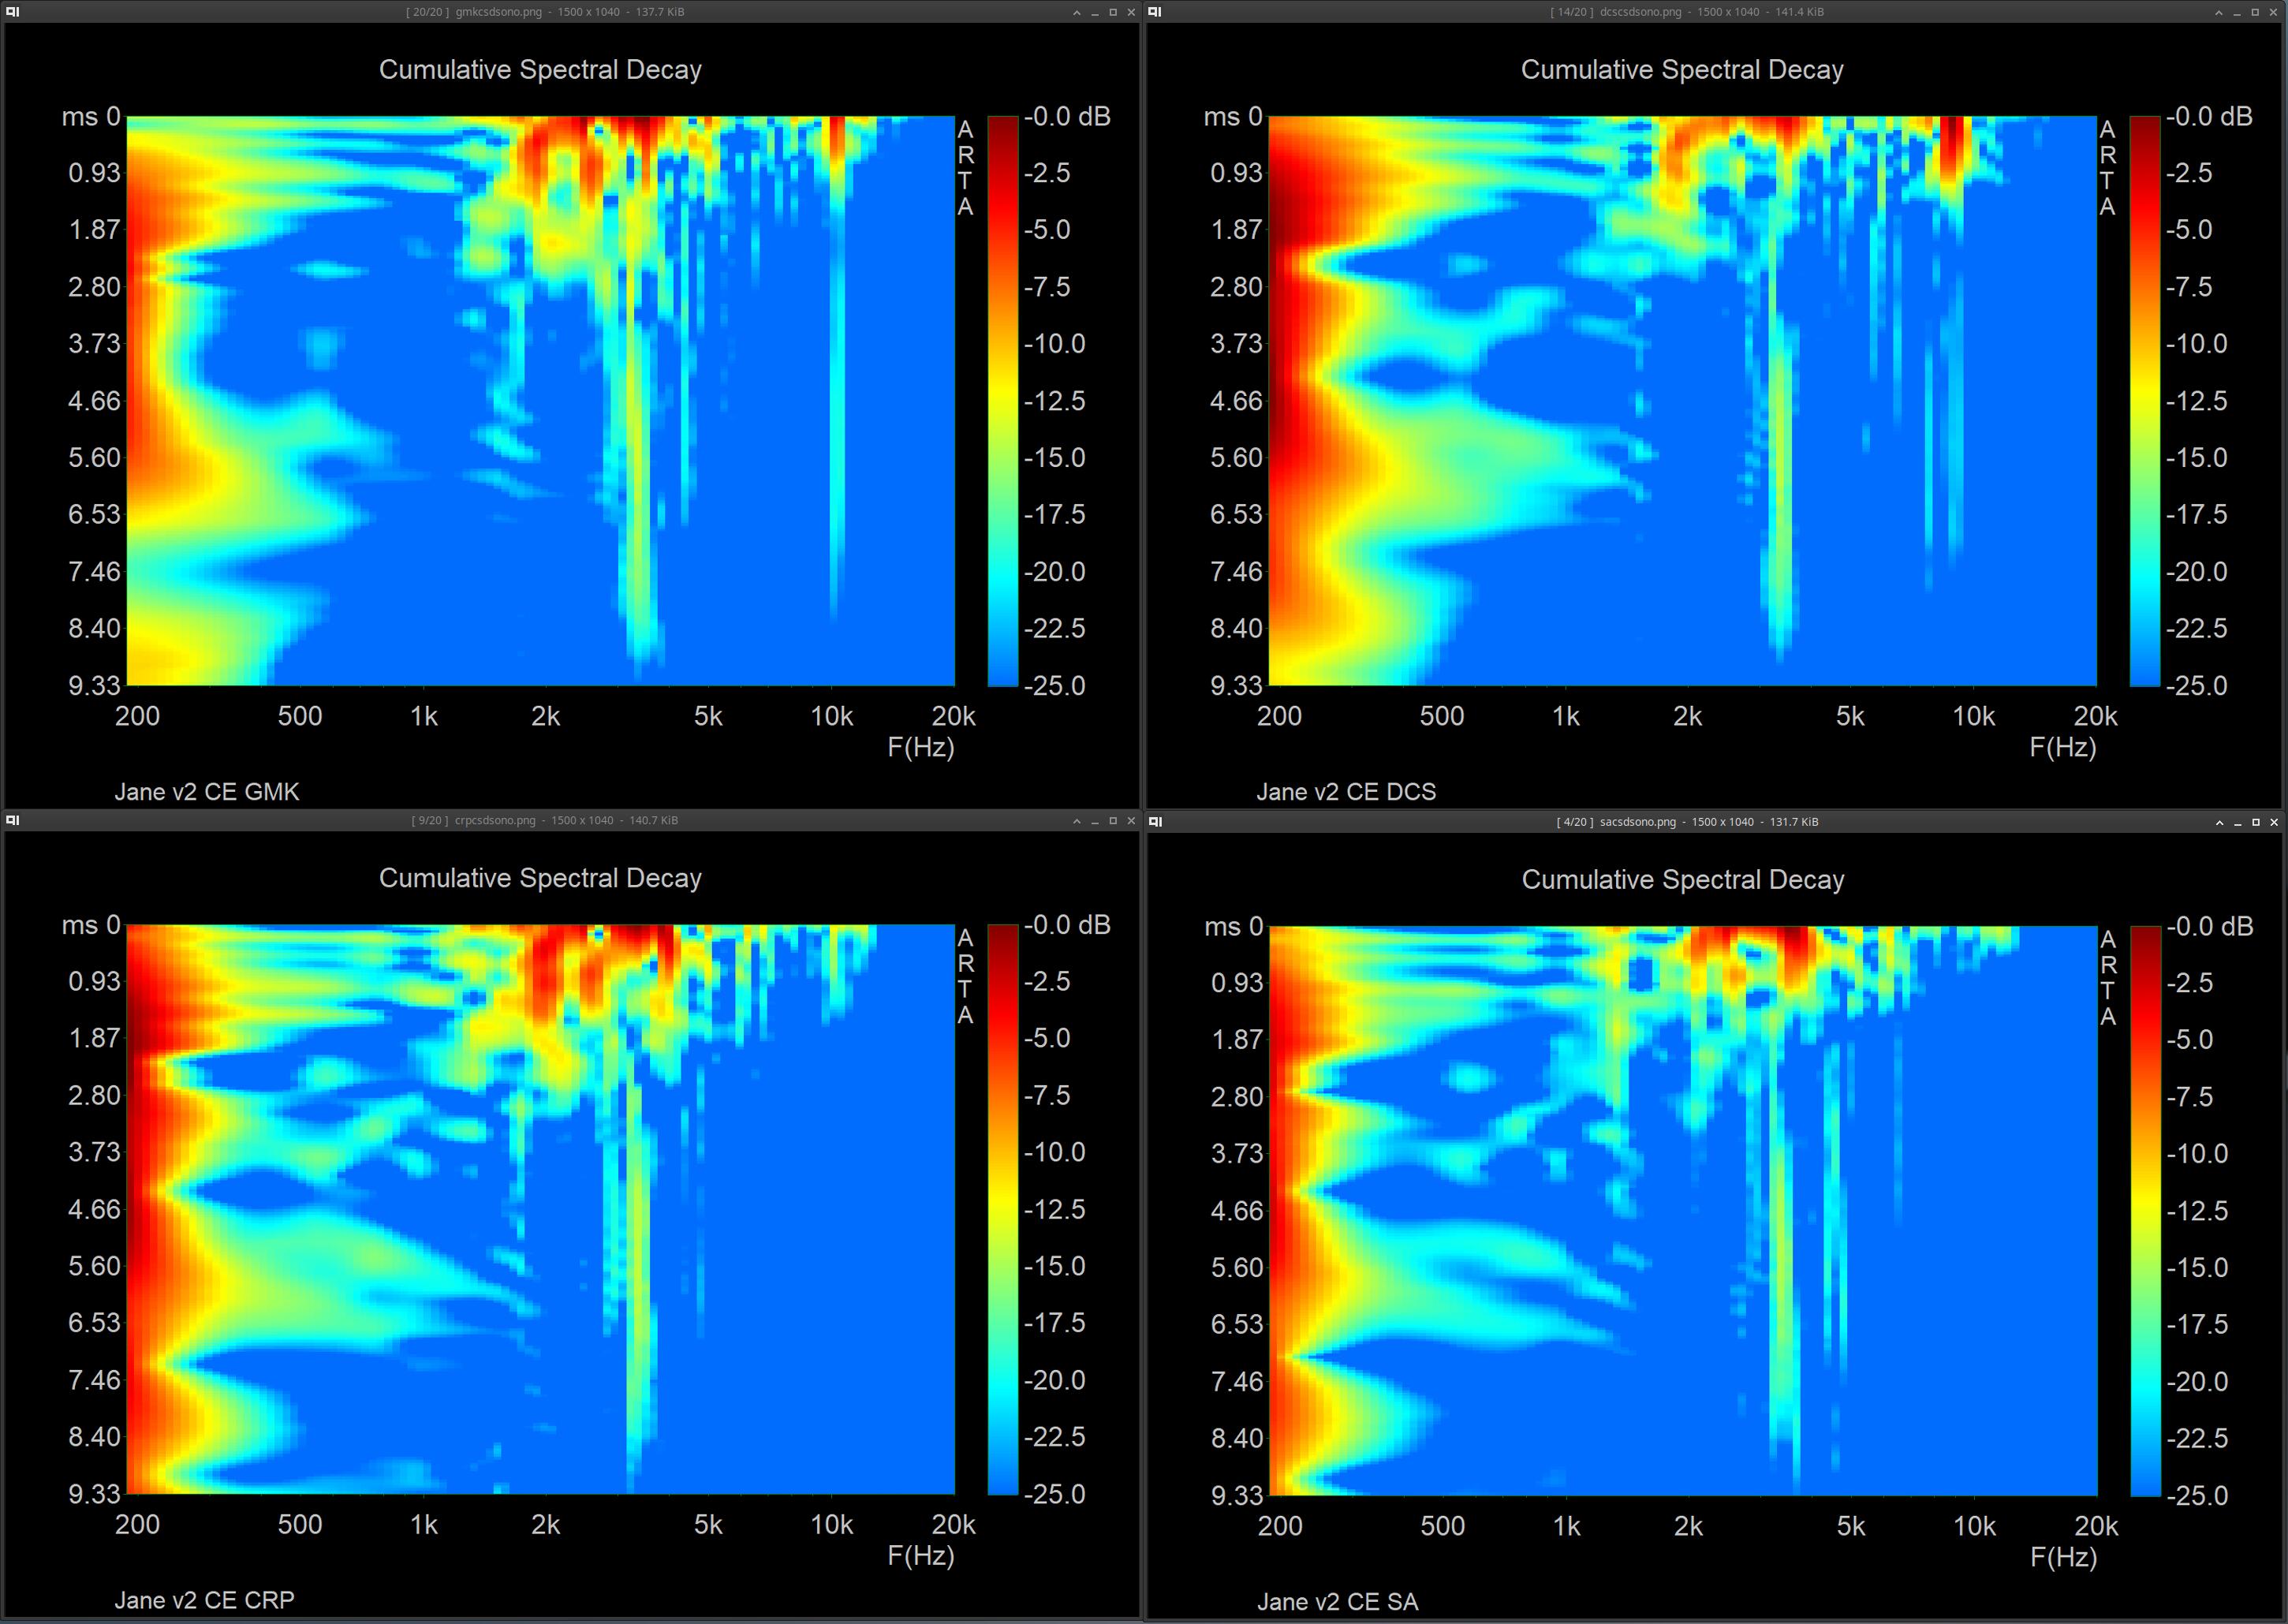
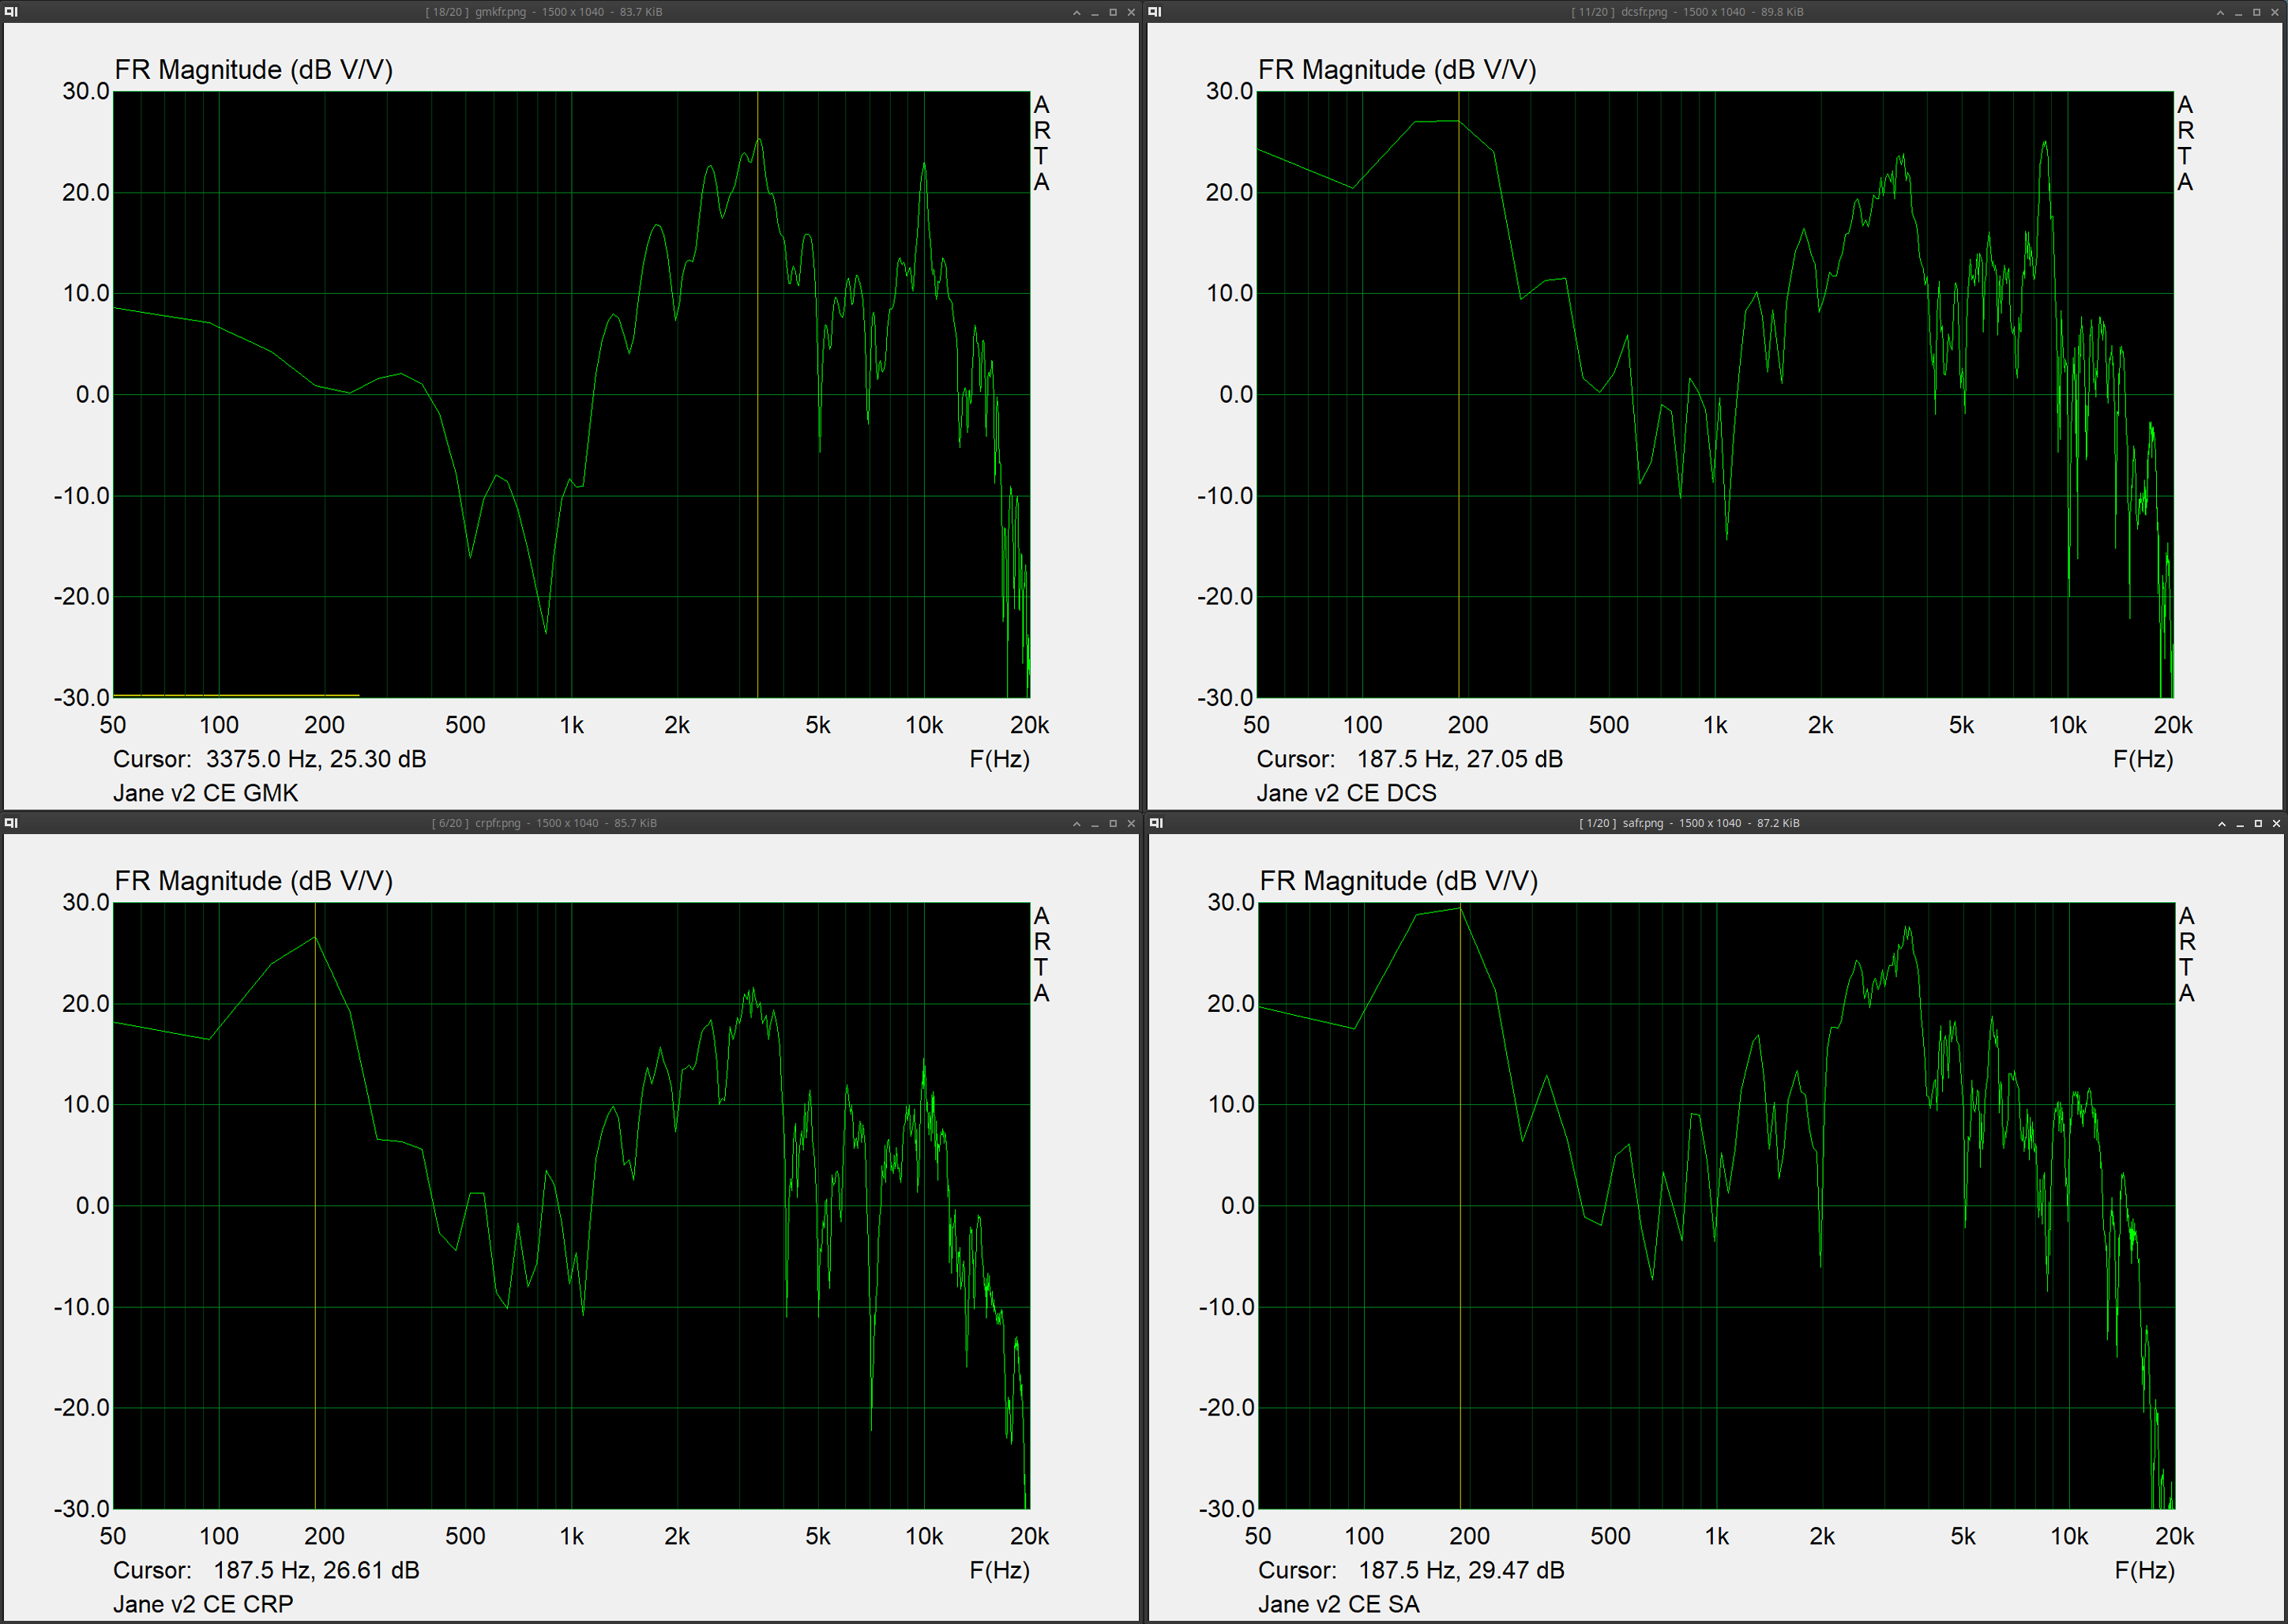
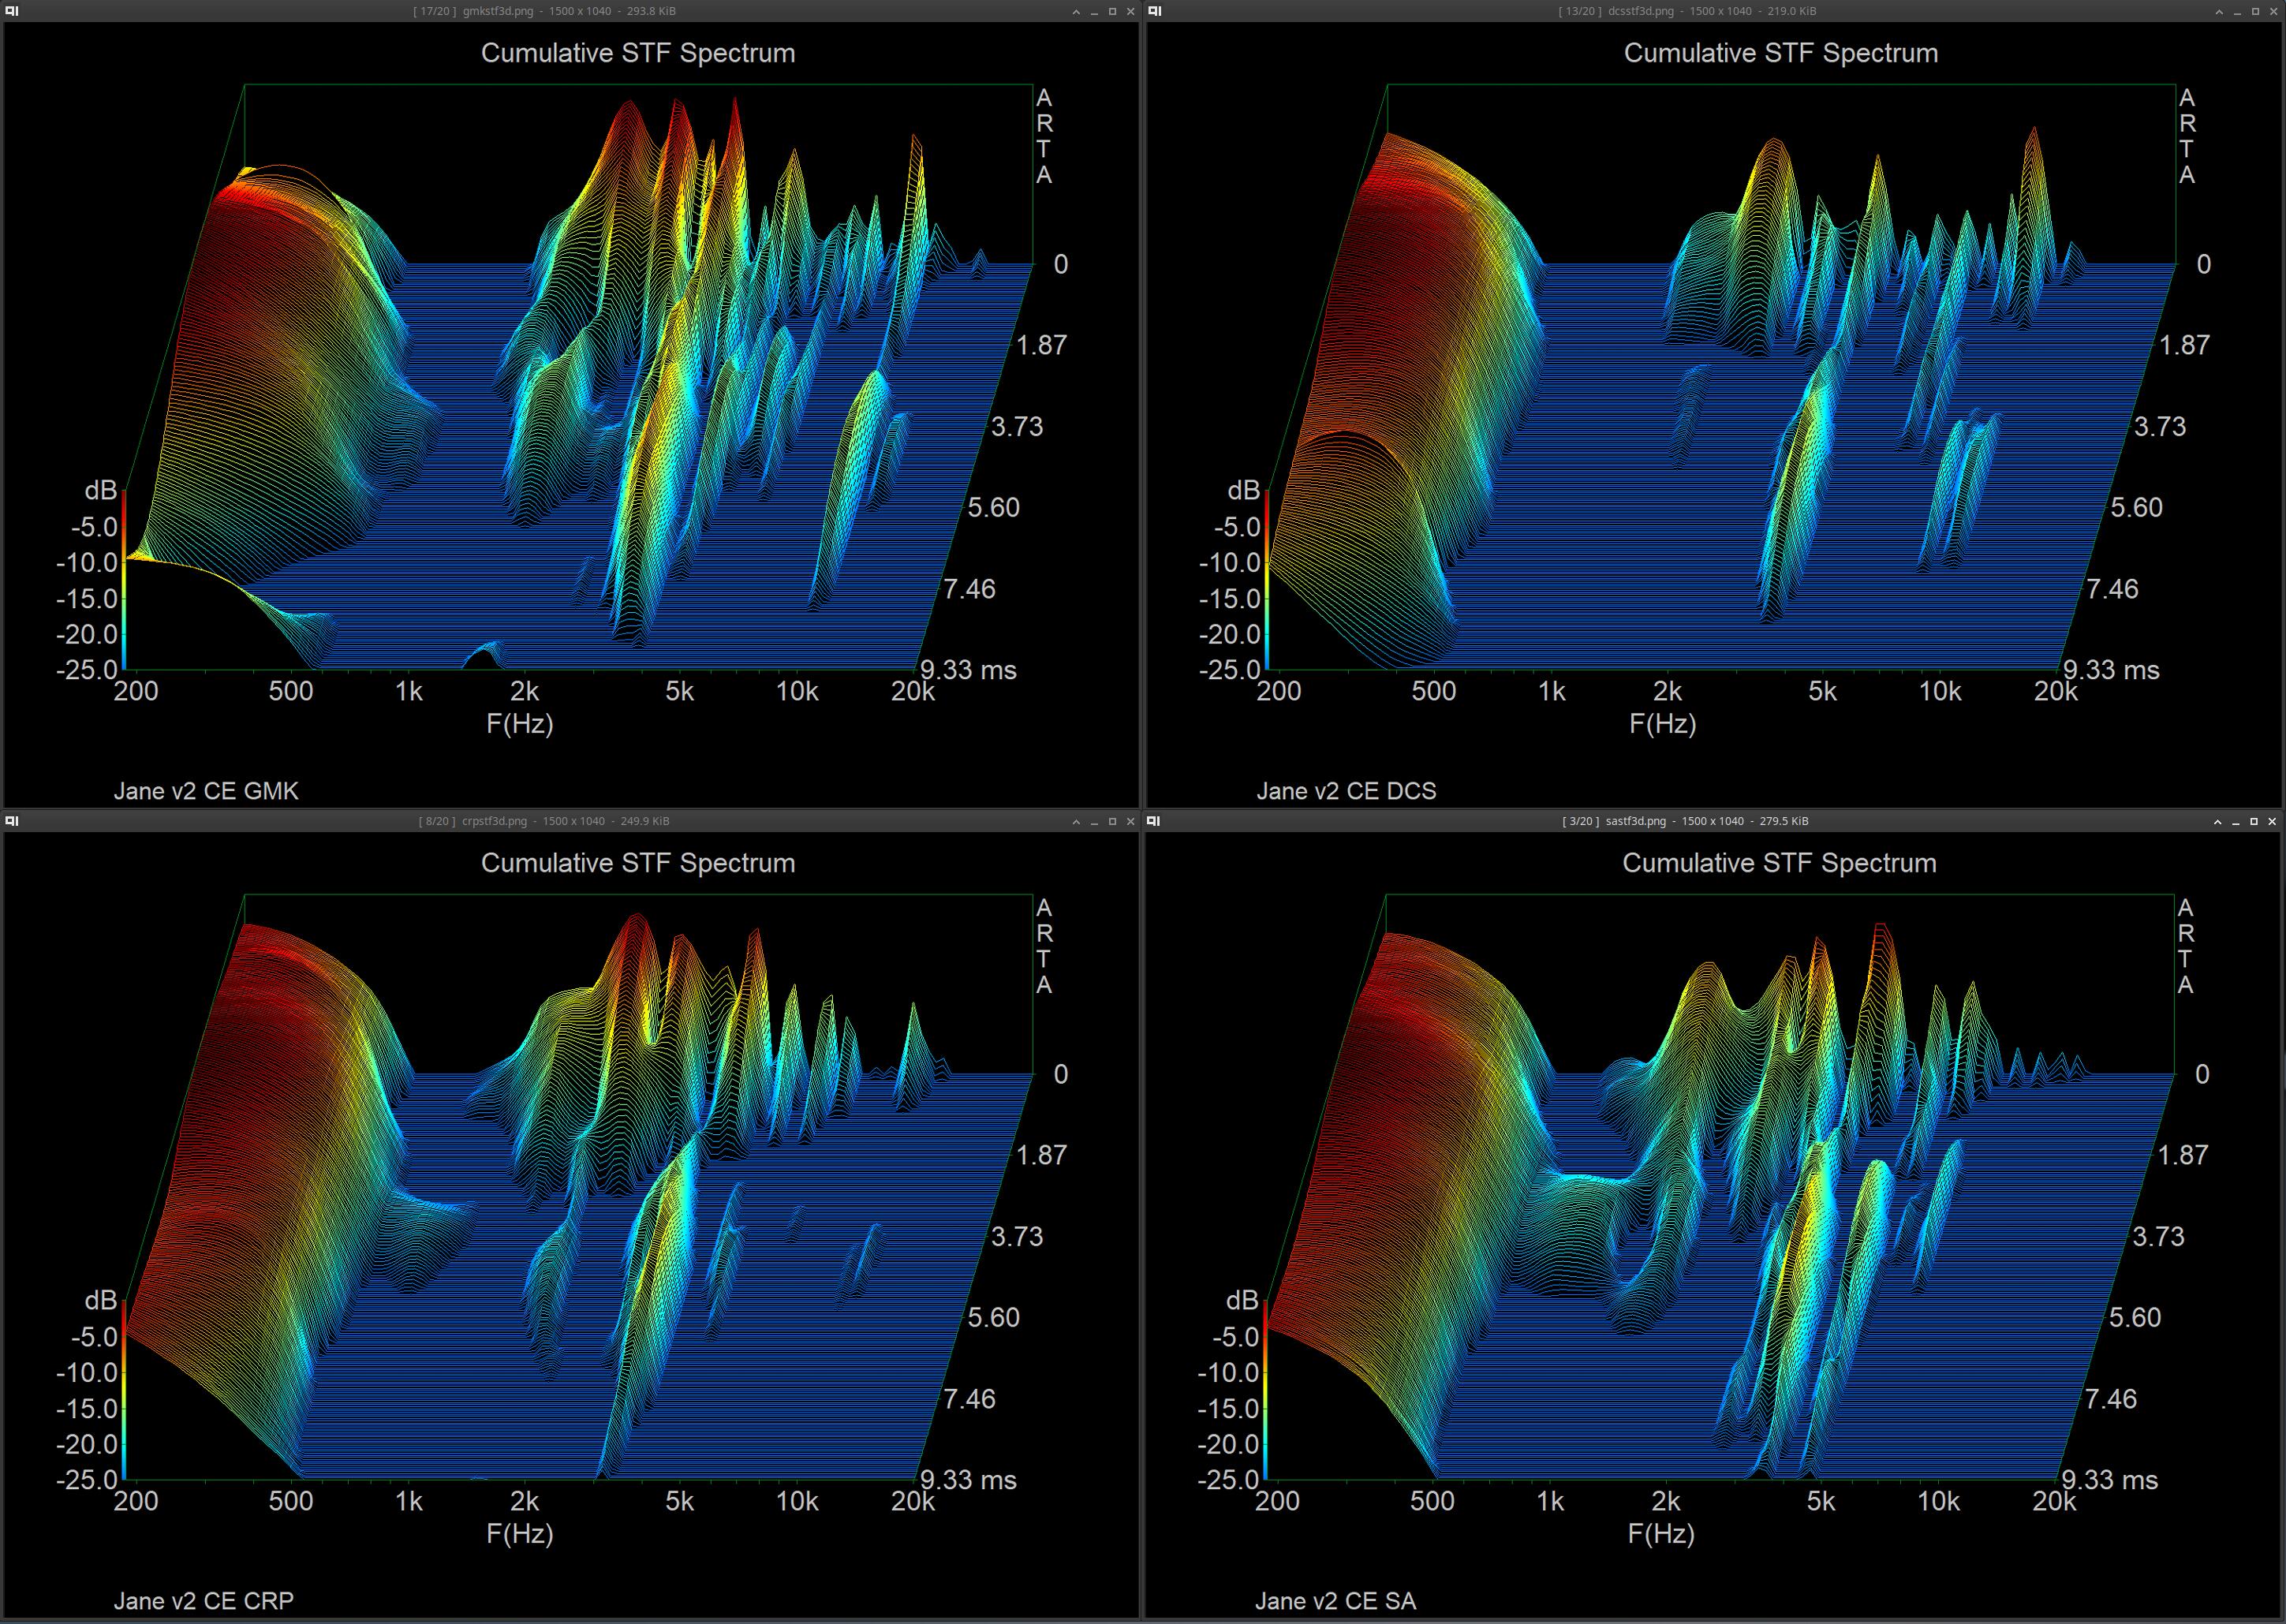
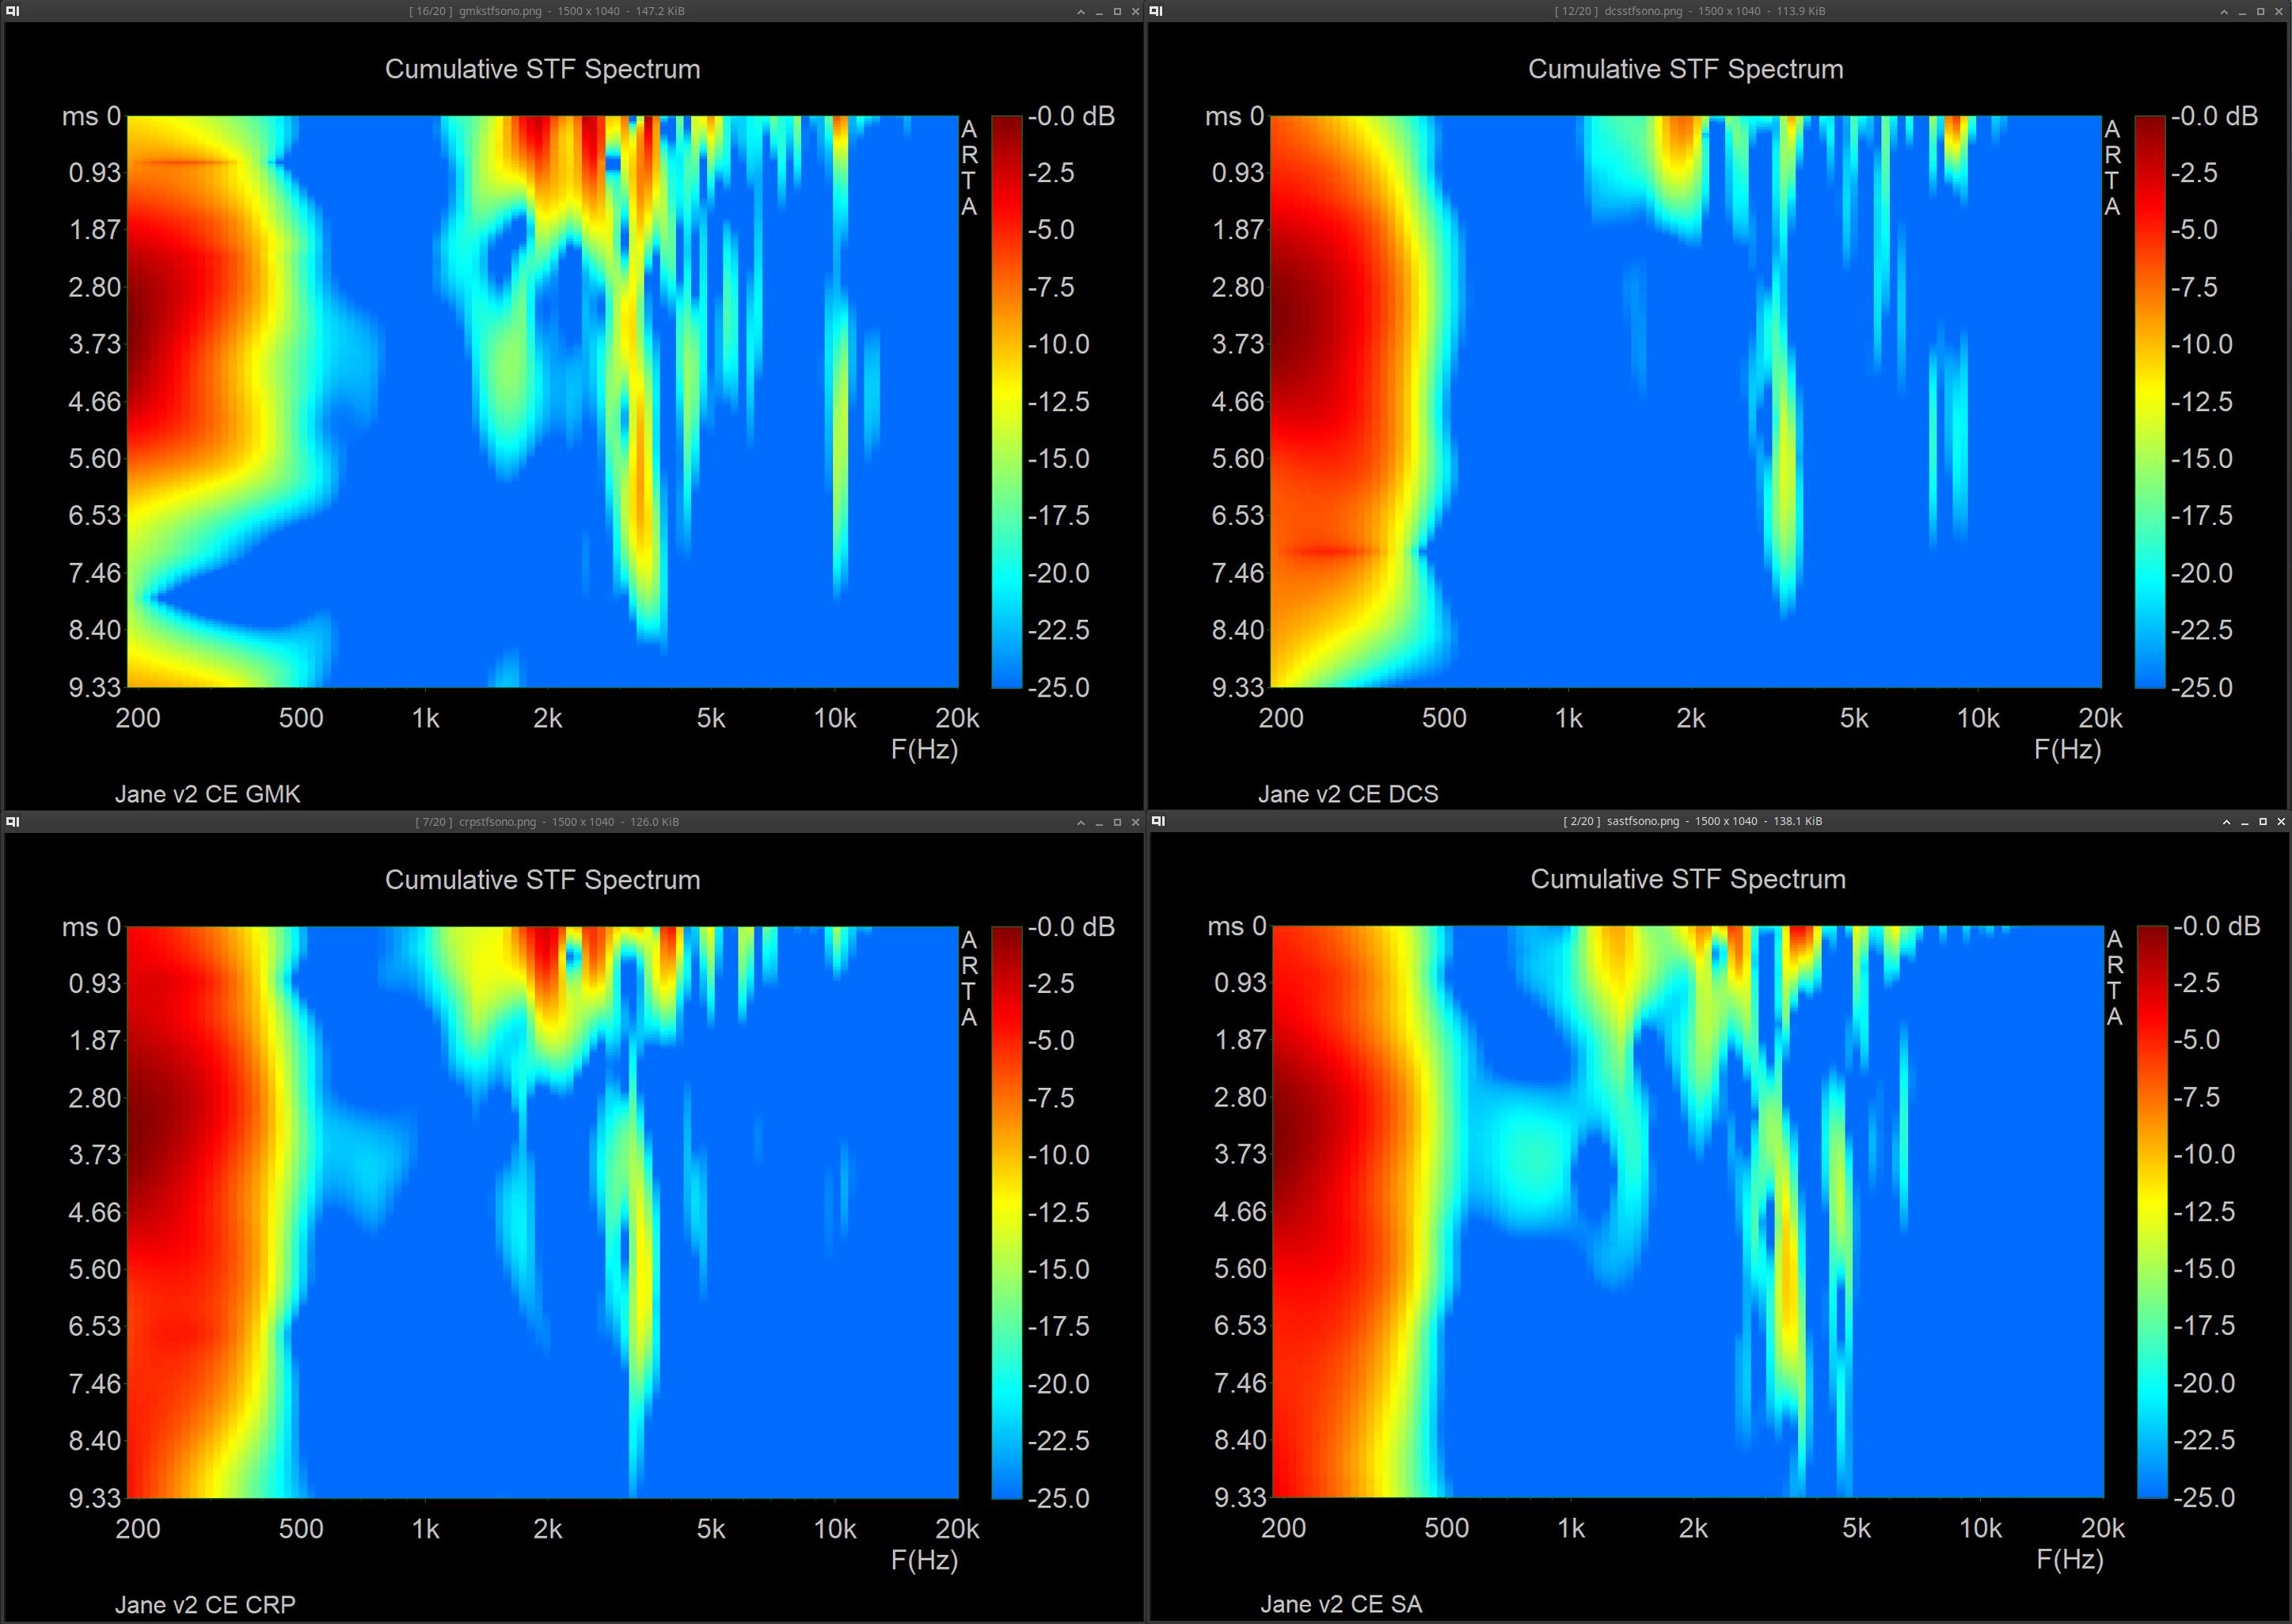
Will stop the spam in this thread after this, and apologies for the bad way to display but it just helps to not have to go though a ton of images lol. Pulled out a more known board (Jane v2 CE with alu plate and mx blacks with sprit slow springs, 205 & 105) and tested GMK CYL, SP DCS, Hammer CRP, SP SA. U87i in omni 15in directly above keyboard, into crane song flamingo → interstellar (24/192), sharply pressing each keycap evenly on the S key, and taking the zero crossing start of the initial sound of the bottom out and starting the measurement there for ~9ms (does not contain sound of return). I found that a FFT of 1024, block shift of 9 samples, and 200 fft blocks was a good balance of resolution in both freq and time. I tested both CSD & STF, along with FR

I do think that somehow I ended up pressing the key with GMK a bit light avoiding some of the v2ce thud, but otherwise similar to the rest. Again this isn’t the best setup for this, but I do think that some of what this represents is interesting in comparison to eachother

1 Like